Single‑cell analysis reveals distinct immune characteristics of hepatocellular carcinoma in HBV‑positive vs. HBV‑negative cases
- Authors:
- Published online on: July 1, 2025 https://doi.org/10.3892/mco.2025.2871
- Article Number: 76
-
Copyright: © Liu et al. This is an open access article distributed under the terms of Creative Commons Attribution License.
Abstract
Introduction
Hepatocellular carcinoma (HCC), a primary liver cancer, presents a significant global health issue, ranking as the sixth most commonly occurring cancer, and the third leading cause of cancer-associated mortality globally (1,2). The incidence of HCC is particularly high in East Asia and sub-Saharan Africa, regions where chronic hepatitis B virus (HBV) infection is endemic (3). HBV is recognized as a significant risk factor in the emergence of HCC. A total of ~300 million individuals are affected by HBV globally, with the virus accounting for almost 50% of all cases of HCC, and virtually all childhood HCC cases (4). Therefore, developing an understanding of the mechanisms via which HBV infection induces HCC is critical for developing effective prevention and treatment strategies, especially for high-risk populations.
One of the critical aspects of HBV infection is its profound impact on the immune microenvironment. The virus has evolved various strategies to evade the host immune system, enabling it to maintain a chronic infection. This evasion is partly achieved via altering the immune microenvironment, which includes the recruitment and modulation of immune cells such as natural killer (NK) cells, T cells and macrophages. These changes can lead to an impaired immune response, enabling the virus to persist and cause ongoing liver damage (5,6).
The immune microenvironment is vital in cancer development. In the context of HBV infection, the altered immune landscape can contribute to the onset and progression of liver cancer. For example, rises in the populations of myeloid-derived suppressor cells and regulatory T cells (Tregs) are often observed, which hinder effective immune responses and support immune tolerance (7,8). On the other hand, the activity of NK cells and cytotoxic T lymphocytes, which are crucial for clearing viral infections, is often diminished (9,10). This dysregulation of immune cell populations may create a tumor-promoting microenvironment. Despite the significant advancements in medical research that have been made (11-14), our understanding of the immune mechanisms via which HBV infection promotes HCC remains poorly understood, largely due to the intricate nature of the immune environment.
Single-cell RNA sequencing (scRNA-seq) has brought about a revolutionary change in terms of how the immune system may be comprehensively analyzed. Its application to immune cell populations has enabled an in-depth characterization of the immune microenvironment, enabling the identification of novel immune subsets in various tumor types, including lung, breast, colorectal, liver and pancreatic cancers (15-20). In the present study, tumors from patients with HCC who were either HBV-positive or HBV-negative were collected, scRNA-seq was performed, and the immune microenvironments of HBV-positive and HBV-negative tumors were compared. It was found that HBV infection significantly alters the landscape of immune cells within HCC, leading to a pronounced suppression and exhaustion of T cells. Specifically, an increase in the proportion of SLC4A10+ CD8+ T cells, which are cells that possess the ability to facilitate tumor initiation, growth and metastasis, was observed, along with an increased population of IFITM3+ macrophages, which perform critical roles in viral clearance. Additionally, a gene, SLC35F1, was identified that is significantly upregulated across various immune cell subtypes within HBV-infected tumors. These findings have provided valuable immunological insights into the pathogenesis and progression of liver cancer in the setting of HBV infection, thereby offering potential targets for immunotherapy in HCC.
Materials and methods
Patient specimens
A total of five male and one female patients from Peking University Shenzhen Hospital were randomly selected for the present study between December 2022 and April 2024, based on the following criteria: (i) No prior antitumor therapy before surgery, and (2) a pathological diagnosis of HCC at TNM stage I. The patients' ages ranged from 49 to 78, with a median age of 63. Among them, three were diagnosed as positive for HBV infection, and the other three were negative for HBV infection. For each patient, fresh tumor samples and their corresponding adjacent non-tumor tissues were collected for subsequent analysis. The present study was approved (approval no. 2022-164) by the Ethics Committee of Peking University Shenzhen Hospital (Shenzhen, China). Written informed consent was obtained by all involved patients.
scRNA-seq library preparation
scRNA-seq libraries were generated using a SeekOne® Digital Droplet Single Cell 3' Library Preparation Kit (cat. no. K00202; SeekGene Biosciences). The libraries were then sequenced on an Illumina NovaSeq 6,000 platform (Illumina, Inc.) with a paired-end 150 bp (PE150) read length.
Raw data processing
Data preprocessing was performed using the SeekSoulTools software (developed by SeekGene Biosciences) with its standard settings. Initially, the process involved converting binary base call (BCL) files into the FASTQ format through the use of cellranger mkfastq (10X Genomics), which referenced a sample sheet that incorporated Seekgene barcodes. Subsequently, the SeekSoulTools count pipeline was employed to facilitate the alignment of sequence reads to the reference genome supplied by 10X Genomics (specifically, the human reference dataset refdata-gex-GRCh38-2020-A). This alignment process included the tallying of reads for each gene, with intronic reads being factored into the count matrix. Additionally, it encompassed the computation of clustering and summary statistics. The output counts from the SeekSoulTools software for each sample were pooled, ensuring uniformity in sequencing depth across the samples. Finally, the feature-barcode matrices were recalculated using the SeekSoulTools package (version 1.2.2).
Single-cell gene expression quantification
To accurately measure gene expression, a strategy that only considered unique molecular identifiers (UMIs) once was implemented, thereby preventing the overcounting of PCR-amplified transcripts. This approach led to the creation of cell-gene UMI matrices, which were crucial for subsequent analysis. The process included the elimination of cells with extreme UMI counts, namely those with very high (>6,000) or very low (<200) counts, to minimize the impact of unwanted variability and to enhance the quality of the cell data. Additionally, to mitigate the influence of potential doublets, a doublet detection method was employed to identify and exclude such cells from our dataset.
Quality control and batch correction
In order to enhance the quality of the cell analysis and to eliminate both low-quality cells and doublets, specific criteria were applied for each sample. Cells were excluded if they had <200 UMIs, or if they expressed <200 or >8,000 genes. This step was crucial for removing cells that might not be reliable for analysis. Furthermore, to exclude cells that may have died or were in the process of dying, those with >5% of their UMIs derived from the mitochondrial genome were also removed. After making these filtrations, a total of 121,848 high-quality single-cell transcriptomes were obtained from all samples. For the integration of samples from different tissues or patients, the ‘harmony’ function of the R package ‘Harmony’ [version 1.2.1; (21)] was utilized to perform batch correction. This step was essential for harmonizing the data from various sources. The counts that were corrected using ‘harmony’ were subsequently employed for Unsupervised Uniform Manifold Approximation and Projection (UMAP) analysis using the R package Seurat, which is a powerful tool for dimensionality reduction and visualization of complex datasets.
Cell clustering
For the purpose of cell clustering, a K-nearest neighbor graph from a Euclidean distance matrix within the principal component analysis space was initially built, which was then transformed into a shared nearest neighbor graph to identify tightly connected cell communities. The Louvain algorithm was subsequently employed to cluster cells, aiming to optimize modularity. For data visualization, the UMAP technique was applied to the cell loadings of selected principal components, incorporating the cluster assignments derived from the graph-based clustering process. When dealing with more than two clusters, the ‘find_all_markers’ function in Seurat was utilized, setting the log-fold change threshold to 0.5 and employing the Wilcoxon rank-sum test to pinpoint marker genes specific to each cluster. For the purpose of identifying genes that were differentially expressed between any two clusters, Seurat's ‘find.markers’ function was employed, together with a log-fold change threshold of 0.5 and using the Wilcoxon rank-sum test. The Seurat R package version 5.1.0 was employed to perform all the analyses described in this section.
Gene set enrichment analysis (GSEA)
Functional enrichment analysis of differentially expressed genes (DEGs) at P<0.05 was executed utilizing the R package ‘clusterProfiler’, version 4.12.6. Additionally, GSEA was performed with the aid of a GSEA desktop application, sourcing gene sets and molecular signatures from the Molecular Signatures Database (https://www.gsea-msigdb.org/gsea/index.jsp). The analysis involved the assessment of 1,000 permutations of gene sets to derive normalized enrichment scores, with a significance threshold of P<0.05 applied to identify the enriched results.
Transcription factor (TF) regulon analysis
The regulatory network and regulon activity were analyzed using pySCENIC (22), the lightning-fast python implementation of the SCENIC pipeline. Regulon activity, quantified by the area under the curve (AUC) scores, was assessed using the AUCell module in pySCENIC, and active regulons were identified based on the module's default threshold. Differentially expressed regulons were determined using the Wilcoxon rank-sum test, implemented via the ‘FindAllMarkers’ function of the Seurat R package, with designated parameters as follows: logfc.threshold =0.25; min.pct =0.1; pseudocount.use =F; and only.pos =T. A heatmap was subsequently generated to visualize the scaled regulon activity expression.
The Cancer Genome Atlas (TCGA)-Liver HCC (LIHC) survival analysis
For TCGA-LIHC data, both gene expression and clinical information were obtained from TCGA using the GDC portal (https://portal.gdc.cancer.gov). Gene expression transcript per million (TPM) values were then log-transformed for further analysis. Survival analysis was performed using the R package ‘survival’, whereas the ‘surv_cutpoint()’ function from the ‘survminer’ package was employed to identify optimal cut-off threshold for cell infiltration, categorizing the data into two groups. Kaplan-Meier survival curves were plotted using the ‘survfit()’ function, and statistical significance among groups was determined by employing the log-rank test.
Cell-cell communication analysis
Intercellular communication in HBV-infected compared with non-HBV-infected HCC was analyzed using the CellChat R package. Separate CellChat objects were created for each condition, and merged via the ‘mergeCellChat’ function. Interaction counts and strengths were assessed using the ‘compareInteractions’ function, whereas differences in interaction numbers and strengths between cell populations across the two datasets were visualized in a heatmap using ‘netVisual_heatmap’. Furthermore, signaling pathway distances were calculated using ‘rankSimilarity’, and significant changes in signal sending and receiving for each cell type were identified using ‘netAnalysis_signalingRole_scatter’. Specific cell population signaling changes were further examined with ‘netAnalysis_signalingChanges_scatter’. Finally, communication dynamics for individual signaling pathways were compared using the ‘netVisual_aggregate’ function.
Immunostaining analysis
Paraffin-embedded HCC tissue sections (4-µm thick) were dewaxed and rehydrated in xylene and graded alcohol solutions. Subsequently, antigen repair was performed by heating the slices in Tris-EDTA (pH=8.0) solution (cat. no. G1206; Wuhan Servicebio Technology Co., Ltd.) at 95-100˚C for 20 min. After cooling the solution to room temperature, the slices were permeabilized with 0.2% Triton X-100 for 10 min and subsequently blocked in blocking buffer (PBS containing 3% BSA (cat. no. ST023; Beyotime Institute of Biochemistry) for 30 min at room temperature. The slices were then sequentially incubated with primary antibodies and fluorescence-conjugated secondary antibodies for 2 and 1 h at room temperature, respectively. Nuclei were stained using 2 µg/ml DAPI (cat. no. 62248; Thermo Fisher Scientific, Inc.) at the same time as staining with secondary antibodies occurred (1 h at room temperature). Finally, the slices were sealed with antifade mounting medium, and images were captured using a Leica SD AF confocal microscopy equipped with a x20 objective. The antibodies used were as follows: anti-CD8 (cat. no. BF00302; 1:20 dilution; BIOSS), anti-SLC4A10 (cat. no. 27197-1-AP; 1:100 dilution; Proteintech Group, Inc.), anti-CD68 (cat. no. 12-0689-42; 1:20 dilution; Thermo Fisher Scientific, Inc.), anti-IFITM3 (cat. no. 11714-1-AP; 1:200 dilution; Proteintech Group, Inc.), anti-CD45 (cat. no. 555485; 1:20 dilution; BD Biosciences), anti-SLC35F1 (cat. no. bs-21265R; 1:200 dilution; BIOSS) and Alexa Fluor 488-Labeled Goat Anti-Rabbit IgG (cat. no. A21206; 1:300 dilution; Thermo Fisher Scientific, Inc.).
Statistical analysis
Each experiment was conducted with three biological replicates, using tissue samples from three HBV-positive and three HBV-negative patients with HCC, unless otherwise specified in the figure legends. Statistical analyses were performed using R or GraphPad Prism 8.0 software (Dotmatics). Comparisons were conducted using unpaired Student's t-test, Wilcoxon rank-sum test, or hypergeometric test. Cumulative survival time was estimated using the Kaplan-Meier estimator, with significance assessed by the Renyi test (Fig. 3I) or log-rank test (Fig. 4I). P<0.05 was considered to indicate a statistically significant difference. The specific statistical tests used to generate each P-value are indicated in the figure legends.
Results
scRNA-seq and cell typing in primary HCC and paired non-tumor liver tissues
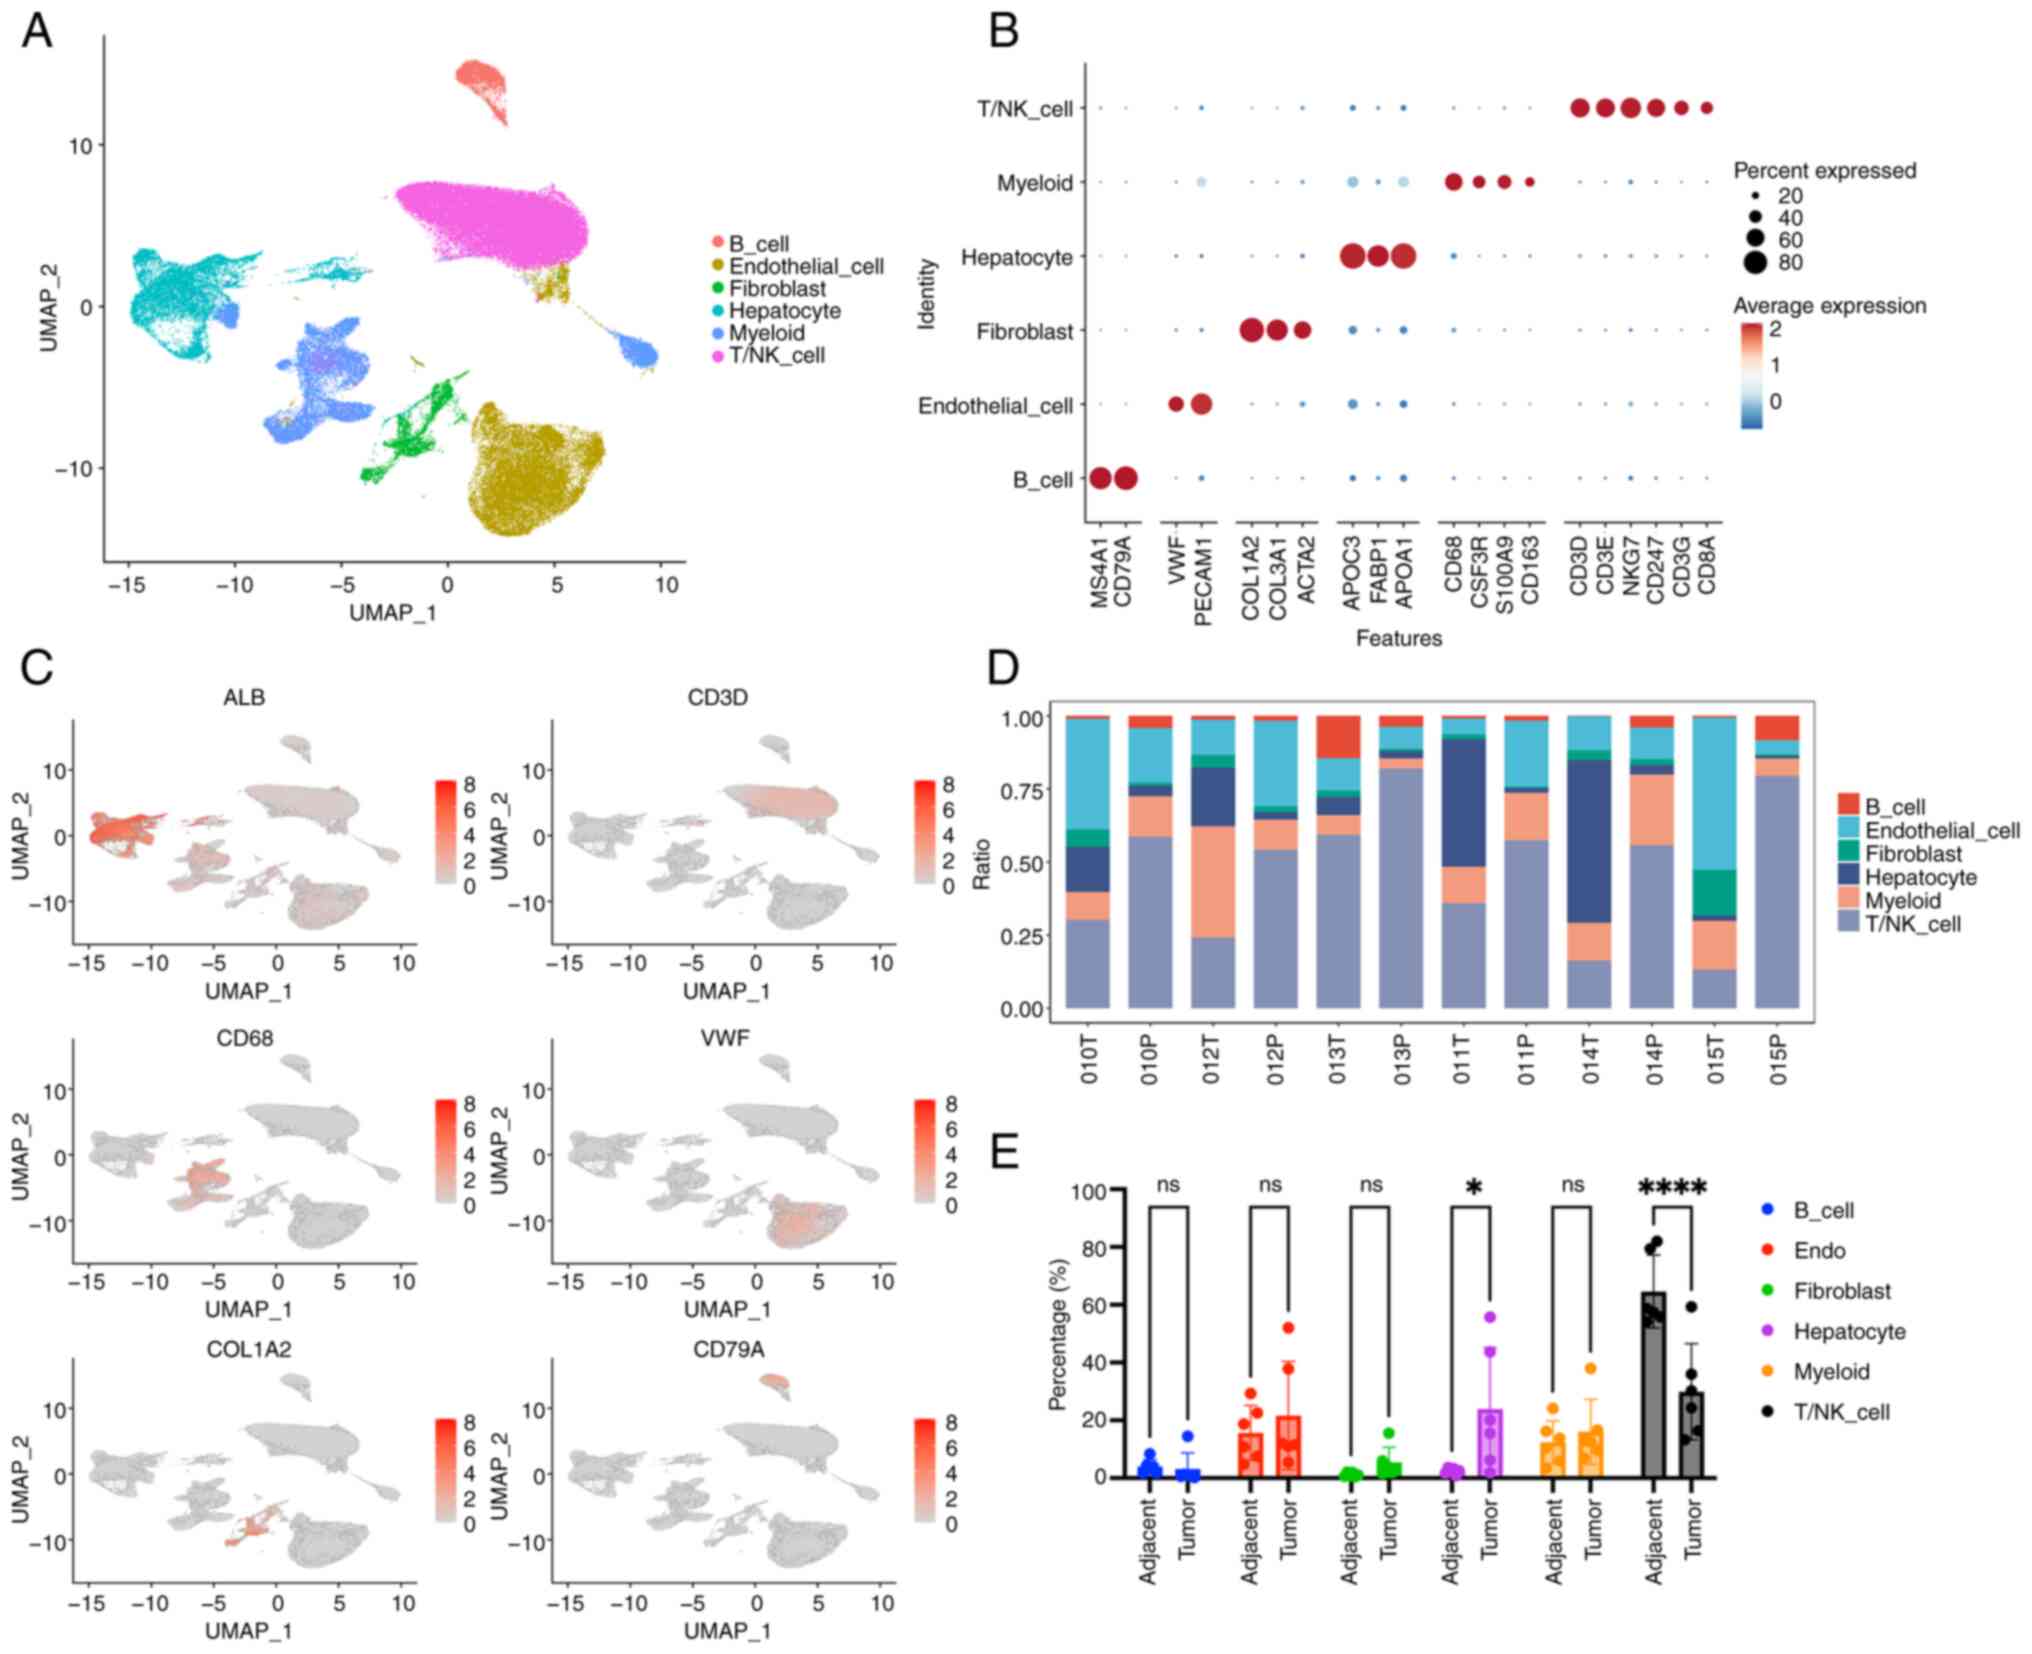
To construct a single-cell atlas of HCC, six patients with primary tumors were recruited. The patients, aged 49-75 years and including both males and females, exhibited no vascular invasion or metastatic features, and were classified as TNM stage I (Fig. S1A). Subsequently, 121,848 single cells were profiled, with an average detection of 1,892 genes per cell (Fig. S1B). To map the global cellular microenvironment of HCCs, scRNA-seq data from all tissues and patients were integrated through a batch correction approach based on the ‘harmony’ package. Unsupervised clustering with a shared-nearest neighbor method identified 11 distinct cell clusters (Fig. S1C). These clusters were subsequently annotated using canonical marker genes, revealing hepatocyte, T/NK cell, B cell, myeloid, endothelial and fibroblast clusters (Figs. 1A and B and S1D). Marker gene expression further validated the specificity of each cluster (Fig. 1C). In addition, the distribution of annotated cell types across the 12 samples was also analyzed (Fig. 1D). Notably, the percentage of T/NK cells was found to be considerably lower in tumor tissues compared with the adjacent tissues, suggesting an immune-suppressive tumor microenvironment (TME) (Fig. 1E).
HBV-infected HCC displays a unique clustering and transcriptomic profile compared with non-HBV-infected HCC
In addition to isolated tumor and adjacent tissues, the scRNA-seq dataset also included HBV-infection or non-HBV-infection information, which potentially could provide useful resources to compare the clustering and transcriptomic profile of HCC with or without HBV infection. To explore this issue further, our attention was focused on the tumor-scRNA-seq dataset and characterization of the cell clustering information. It should be noted that HBV-infected HCC was defined as ‘HBV-positive’ or ‘Po’, whereas non-HBV-infected HCC was defined as ‘HBV-negative’ or ‘Ne’. The cell-density map revealed that a clear difference existed between the HBV-negative and HBV-positive samples (Fig. 2A). Most significantly, the proportions of B cells and T/NK cells were significantly increased under conditions of HBV infection, which suggested that HBV infection may result in an increased infiltration or proliferation of those types of cells (Fig. 2A). To further confirm this observation, the percentages of each cell type in the six investigated samples were assessed. Although there appeared to be variations among the HBV-negative or HBV-positive samples, possibly due to the heterogeneity of the patients' age, status or other conditions, the overall trend of an increased percentage of B cells and T/NK cells was readily observed (Fig. 2B). Moreover, our calculations of the average percentages of cell types also revealed an increase in the populations of B cells and T/NK cells in HBV-infected tumors (Fig. 2C). Taken together, these results suggested that HBV infection promotes an increase in the ratios of B cells and T/NK cells inside tumors, which thereby modulates the TME in an active state.
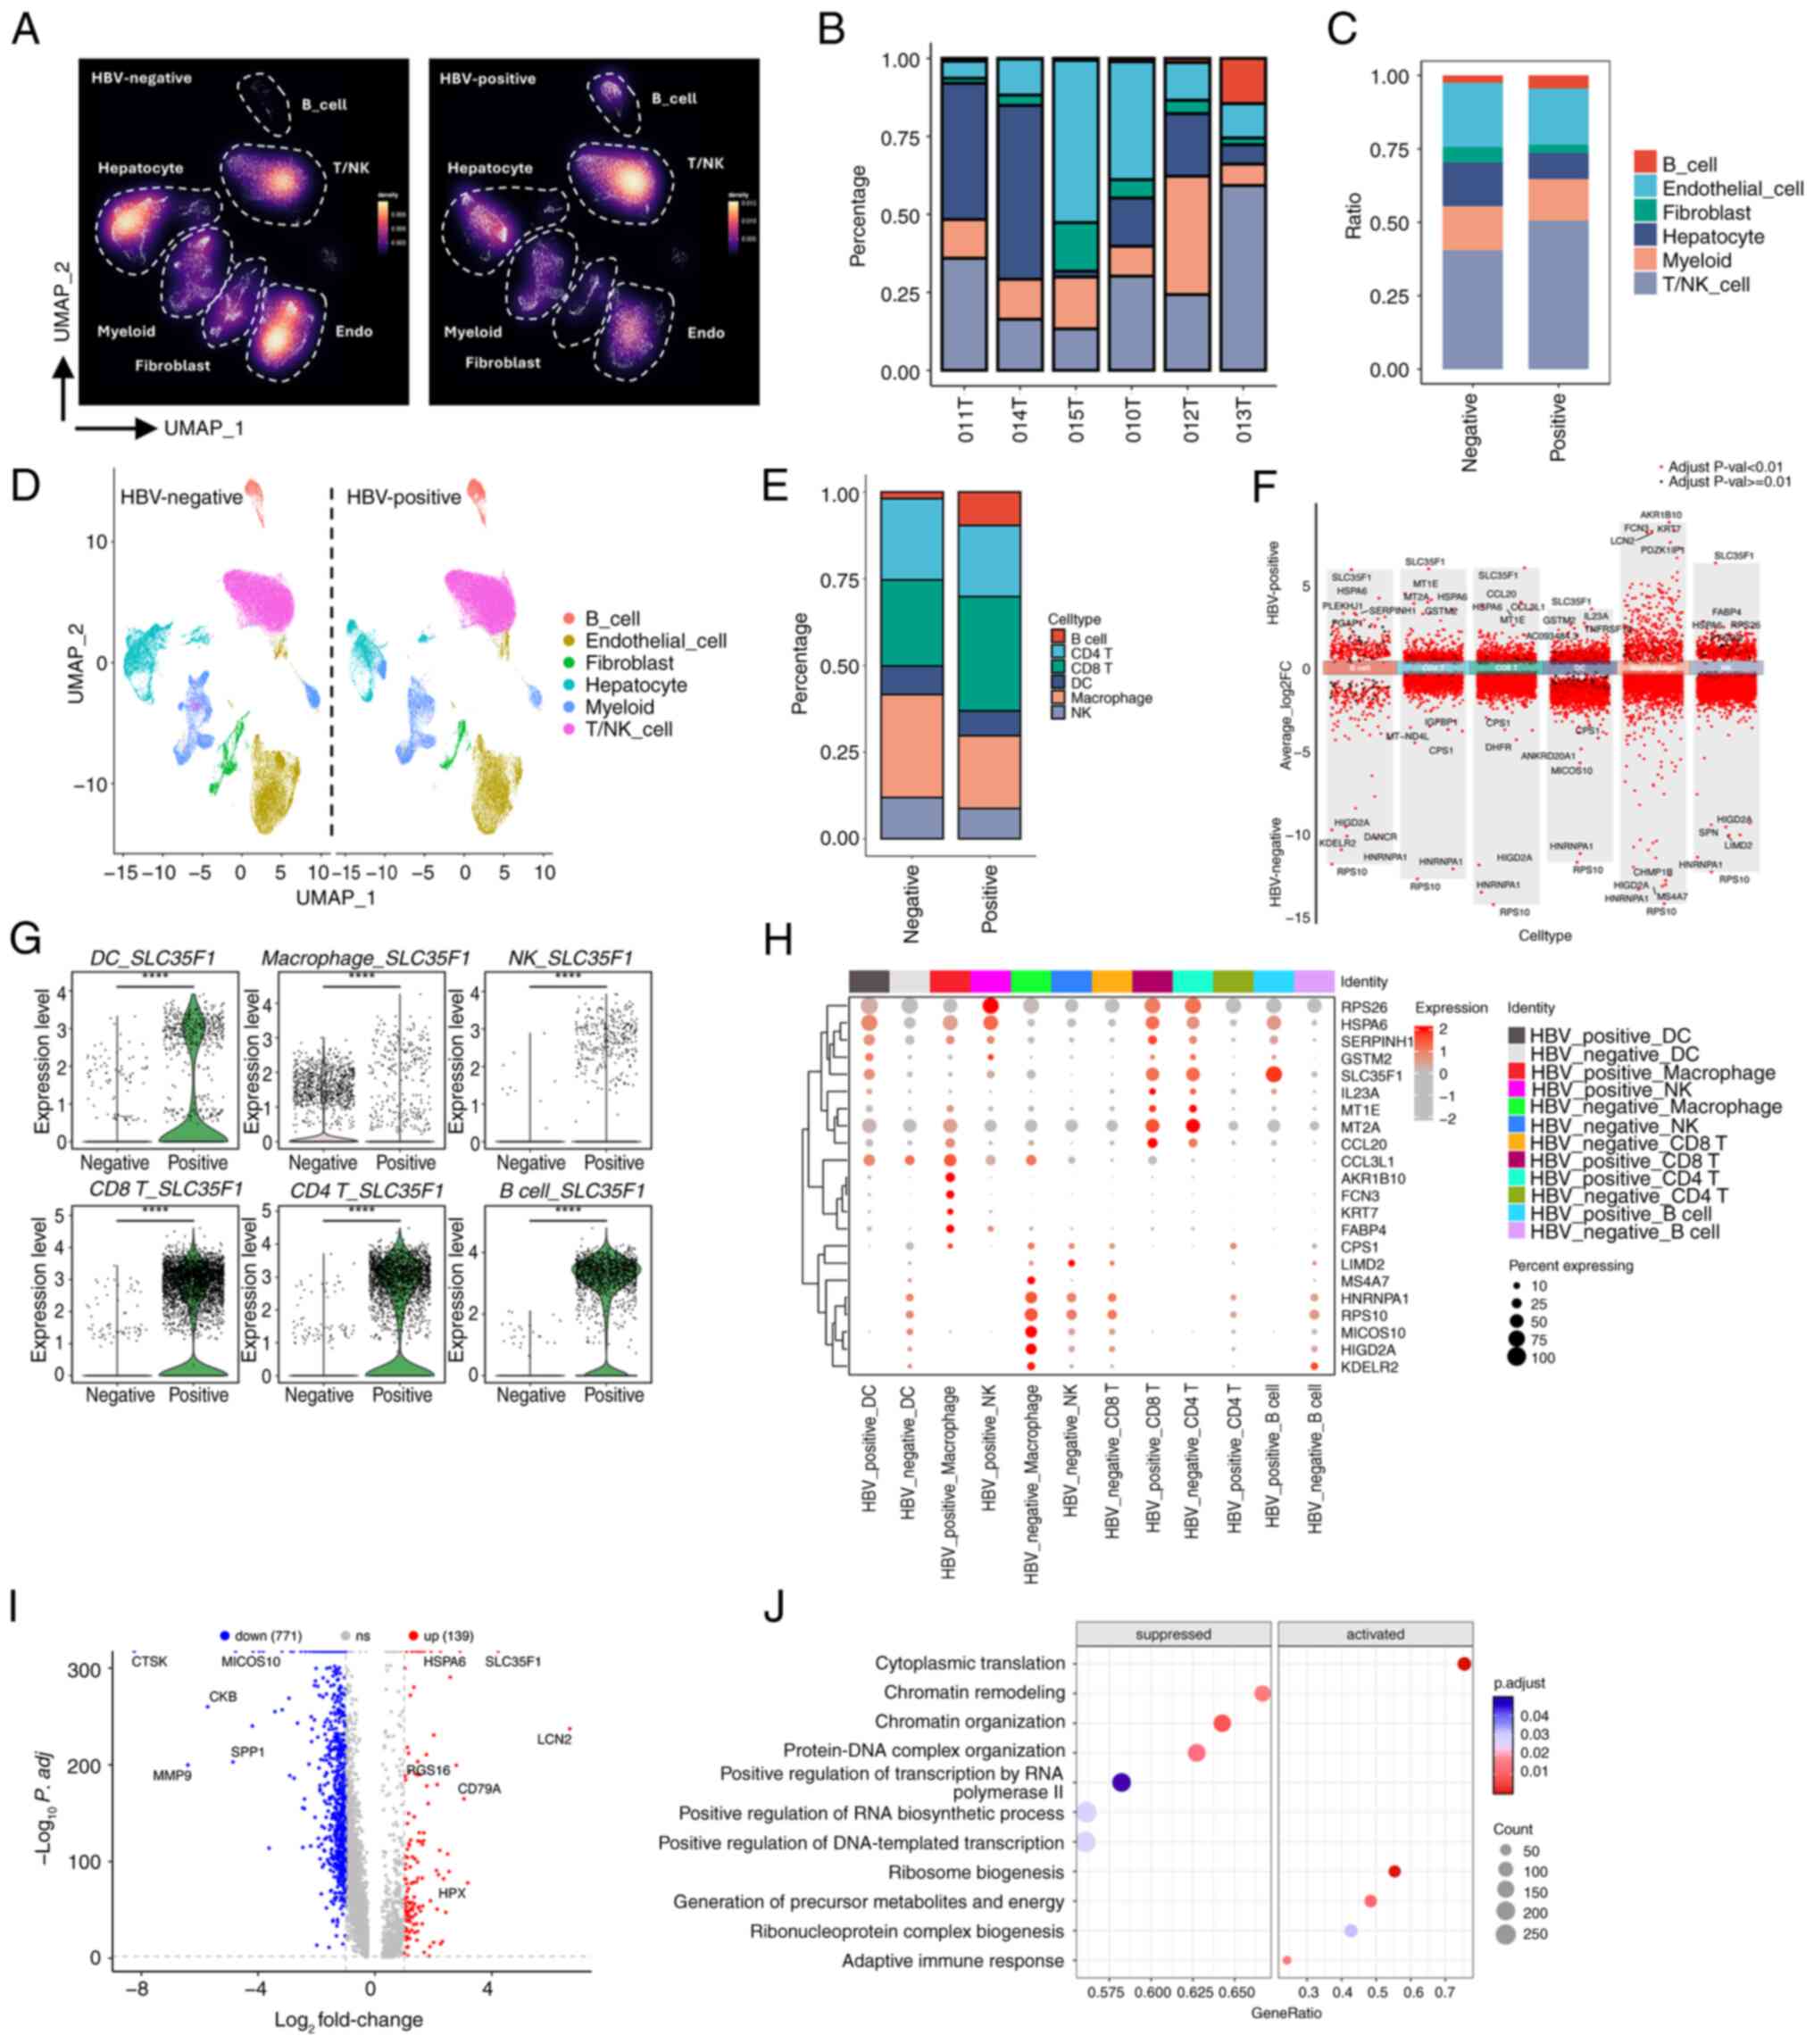
Myeloid cells consist of various subtypes, including macrophages, neutrophils and dendritic cells (DCs). To explore the dynamics of specific immune cells in response to HBV infection, further clustering of the identified cell types was performed. Through marker gene expression analysis, CD4 T cells, CD8 T cells, DCs, macrophages, monocytes, neutrophils and NK cells were identified (Figs. 2D, S2A and B). Among the major immune cells, B cells, CD4 T cells, CD8 T cells, DCs, macrophages and NK cells were found to exhibit marked proportional differences comparing between HBV-negative and HBV-positive samples (Fig. 2E). Specifically, HBV infection led to an overall increase in the proportions of B cells and CD8 T cells, whereas the percentages of NK cells and macrophages were decreased. Since B cells and T cells are the main cells of the adaptive immune system, whereas NK cells and macrophages are important components of the innate immune system, this suggested that HBV infection may produce chronic infection and local inflammation, ultimately leading to enhanced adaptive immunity and weakened innate immunity, which contributes to the immune escape of tumors. To investigate molecular changes within these immune cells upon HBV infection, DEG analysis was subsequently performed. This analysis revealed the presence of both upregulated and downregulated genes in each type of immune cell (Fig. 2F). Notably, SLC35F1, a gene associated with nucleoside transport and metabolism (23,24), was found to be consistently upregulated across multiple immune cells, including B cells, CD4 T cells, CD8 T cells, DCs and NK cells (Fig. 2F). Further examination of the data confirmed that SLC35F1 was significantly upregulated in all immune cell types, including macrophages (Fig. 2G). This finding was additionally substantiated through immunofluorescence staining of SLC35F1 alongside the pan-immune cell marker CD45 in tumor samples (Fig. S2C). When comparing the top four DEGs for each immune cell type, both distinct and shared DEGs were observed, with SLC35F1 being prominently highlighted (Fig. 2H). Subsequently, all the immune cells under either HBV-negative or HBV-positive conditions respectively were combined, and DEG analysis was performed. This analysis revealed the presence of 139 upregulated and 771 downregulated genes upon HBV infection (Fig. 2I). Gene Ontology (GO) and Kyoto Encyclopedia of Genes and Genomes (KEGG) analyses of these altered genes subsequently showed that the upregulated genes were enriched in pathways related to ribosome biogenesis, protein folding and leukocyte activation, suggesting that HBV infection promotes active protein synthesis, metabolism and immune activation (Fig. S3A and B). On the other hand, downregulated genes were associated with insulin response, hormone signaling and AMPK activation pathways (Fig. S3A and B). GSEA further revealed that immune cells in HBV-infected tumors exhibited increases in the activity of signaling pathways associated with adaptive immune responses and antiviral defense (Figs. 2J and S3C). Considered altogether, the scRNA-seq analysis demonstrated that HBV infection alters both the proportions and transcriptomic profiles of immune cells, with SLC35F1 identified as a commonly upregulated gene across the majority of the immune cell types in response to infection.
Characterization of T cell heterogeneity in both HBV-infected and non-HBV-infected HCC
T cell immunity has a vital role in both tumor growth and immune surveillance in HCC (25,26). Infection with HBV is known to significantly reshape the immune landscape, impacting the effectiveness of immune responses (6,27). However, the heterogeneity of T cells in HCC under the different conditions of HBV infection status remains poorly understood. Therefore, to improve understanding of how HBV infection influences T cell diversity in HCC, the current scRNA-seq data were analyzed with a focus on CD4+ and CD8+ T cells.
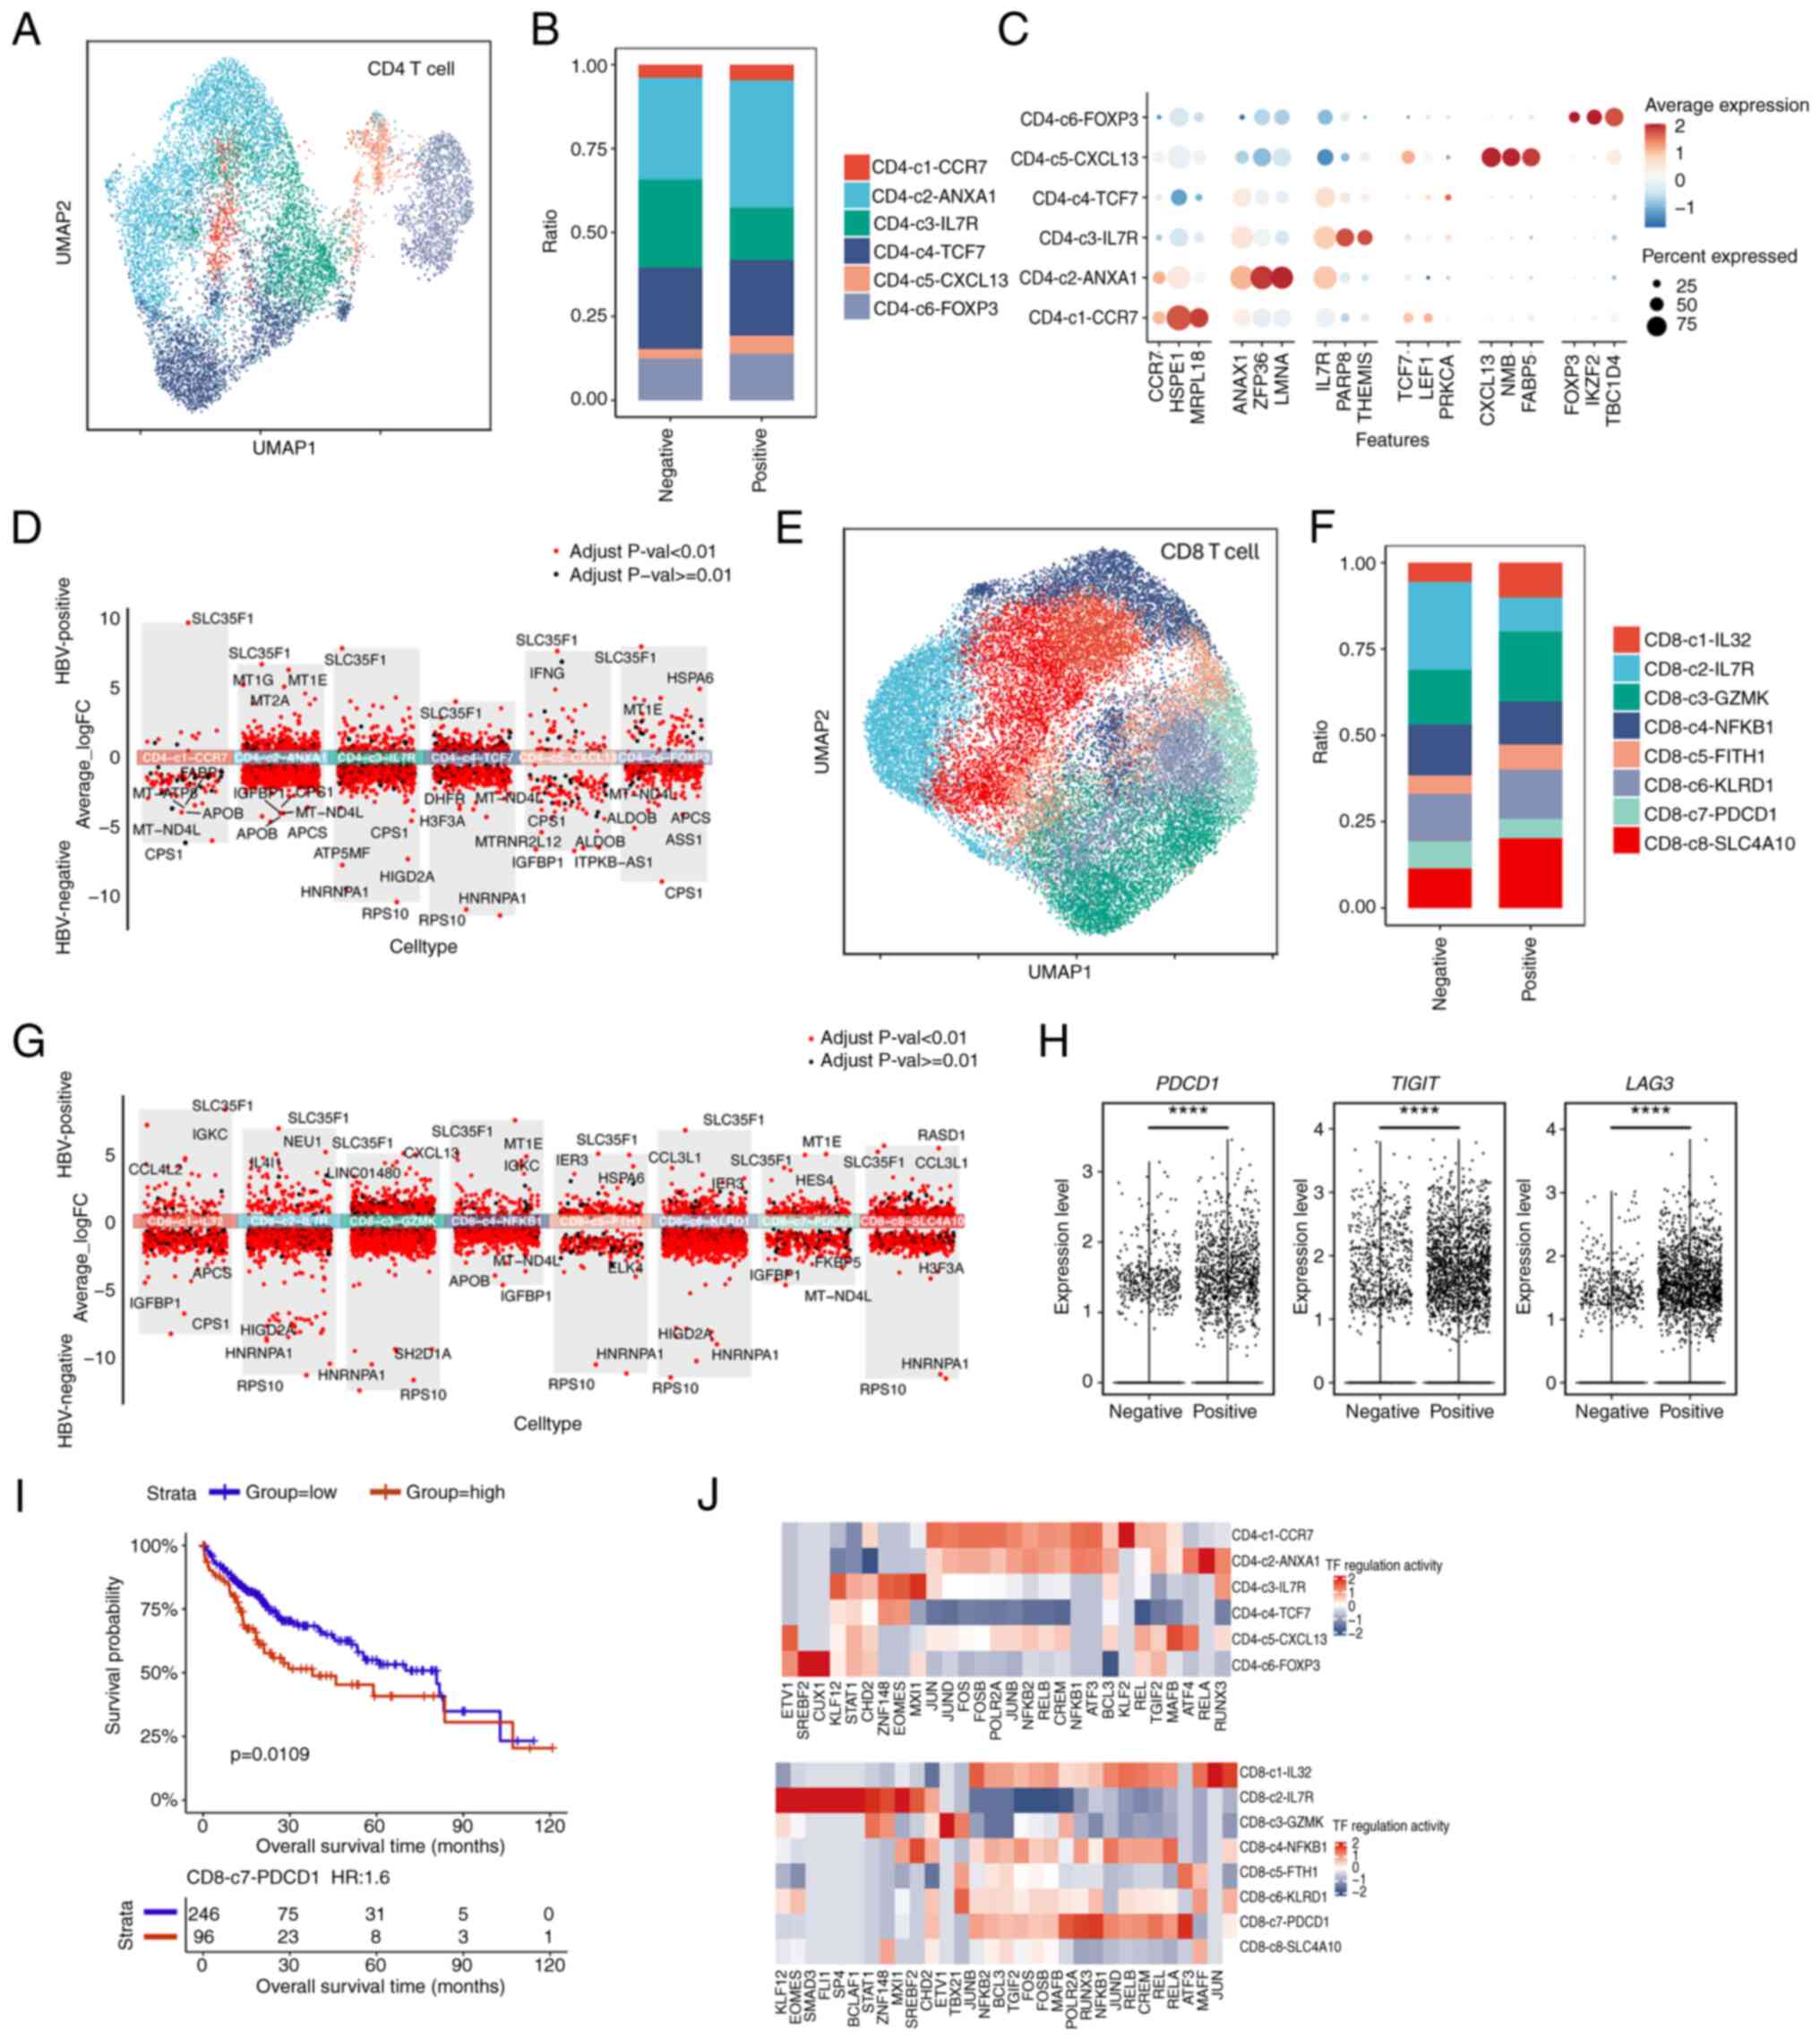
CD4+ T cells are crucial for orchestrating immune responses. Leveraging established cellular signature markers from the literature, CD4+ T cells were classified into six distinct subtypes to examine their proportional differences between HBV-infected and non-HBV-infected samples (Figs. 3A and B and S4A). These subtypes were further defined by their marker gene expression profiles to elucidate their functional roles (Fig. 3C). This analysis revealed a decrease in the proportion of IL7R+ CD4+ T cells and an increase in the proportion of ANXA1+ CD4+ T cells in HBV-infected samples (Fig. 3B). IL7R is the marker of stem-like T cells, and IL7R+ CD4+ stem-like T cells are able to differentiate into Th1, Th2 and other effector cell subpopulations, thereby promoting the effector differentiation of CD8+ T cells through secreting cytokines (such as IFN-γ) and enhancing antitumor immunity (28). Therefore, HBV infection reduces the IL7R+ CD4+ stem-like T cell population, which suggests that HBV limits the differentiation potential of stem-like T cells and reduces the antitumor immunity. Moreover, annexin A1 (ANXA1) is the key gene that inhibits inflammation (29), and ANXA1+ CD4+ anti-inflammatory cells may include Tregs, which secrete anti-inflammatory cytokines (for example, IL-10 and TGF-β) that inhibit the activity of other immune cells and promote tumor immune escape. Therefore, an increase in the ratios of ANXA1+ CD4+ T cells upon HBV infection suggests an immunosuppressive state of the TME. To investigate this further, a DEG analysis for each CD4+ T cell subtype comparing between HBV-positive and HBV-negative groups was performed. SLC35F1 was clearly shown to be consistently upregulated across all classified subtypes (Fig. 3D), highlighting its potential role as a key mediator or functional gene responsive to HBV infection.
In addition to CD4 T cells, the CD8+ T cells, which have a crucial role in coordinating cytotoxic responses against tumors, were also examined. The CD8+ T cells were classified into eight subtypes (Fig. 3E), and distinct differences in the subtype distributions were observed between HBV-infected and non-infected groups (Figs. 3F and S4B). To understand their functional states, key marker genes indicative of exhaustion, effector, naive and memory characteristics were assessed (Fig. S4C). The subtypes of CD8+ T cells were found to exhibit more dynamic changes in response to HBV infection (Fig. 3F). Notably, the proportion of SLC4A10+ CD8+ T cells was increased, whereas that of PDCD1+ CD8+ T cells was decreased under HBV-infected conditions. The fact that HBV-infected tumors displayed a higher proportion of SLC4A10+ CD8+ T cells was further confirmed by immunofluorescence assay (Fig. S4D). SLC4A10+ CD8+ is considered to be the marker of mucosal-associated invariant T (MAIT) cells, which secrete cytotoxic molecules and cytokines. In particular, MAIT cells are often found in chronic viral hepatitis tissue in an activated and severely exhausted state (30). Therefore, an increase in the population of MAIT cells would suggest that HBV infection leads to an inflammatory response in liver cancer tissue, and furthermore, changes in the proportions of PDCD1+ CD8+ cells would be indicative of an alteration in T cell exhaustion upon HBV infection.
Subsequently, DEG analysis was performed to examine differences in the transcriptomic profiles of each CD8+ T cell subtype comparing between HBV-negative and HBV-positive groups. Again, SLC35F1 emerged as a prominently upregulated gene across all subtypes, indicating its potential regulatory role in CD8+ T cells (Fig. 3G).
Interestingly, despite the reduced proportion of PDCD1+ CD8+ T cells that was observed upon HBV infection, a significant upregulation of exhaustion-marker genes, including PDCD1, LAG3 and TIGIT, was found in the overall CD8+ T cell population (Fig. 3H). This suggested that HBV infection promotes CD8+ T cell exhaustion, potentially contributing to immune dysfunction in the HBV-infected environment.
To further explore the clinical impact of T cell subtype distribution, a survival analysis using TCGA-LIHC data was performed, focusing on T cell infiltration levels as defined by the scRNA-seq data of the present study. It was found that an increased infiltration of the CD8-c7-PDCD1 subtype, indicative of exhaustion, was significantly associated with poorer prognosis (P=0.0109; Fig. 3I). These data were consistent with the observation that the PDCD1+ CD8 T cells displayed higher levels of exhaustion marker expression (Fig. 3H), suggesting that inhibiting PDCD1+ CD8 T cells may exert a positive effect on the overall survival of patients. Since transcriptional regulation is a key determinant in T cell differentiation and function, pySCENIC was used to identify the most active TFs across the T cell subtypes. In particular, it was found that, for the CD4-c3-IL7R subtype, the genes MXI1 and EOMES exhibited the highest levels of regulation activity, whereas for the CD8-c7-PDCD1 subtype, RELA, RUNX3, POLR2A and MAFB showed the highest regulation activity (Fig. 3J). Collectively, these data suggested that these important TF regulators may perform regulatory roles on the fate determination or differentiation of the T cells shaped by the HBV-infection status.
In conclusion, our analysis of T cell heterogeneity in HCC has revealed distinct CD4+ and CD8+ T cell subtypes with or without the HBV infection condition, also disclosing that certain T cell subtypes associated with patient outcomes, such as CD8-c7-PDCD1, are associated with poorer survival. These results, combined with TF regulon analysis, have enhanced our understanding of T cell diversity in HBV-infected compared with non-infected HCC. Moreover, these findings have highlighted the importance of targeting specific T cell subtypes and regulatory pathways to improve therapeutic strategies for HCC.
Characterization of macrophages and DCs in HBV-infected and non-HBV-infected HCC
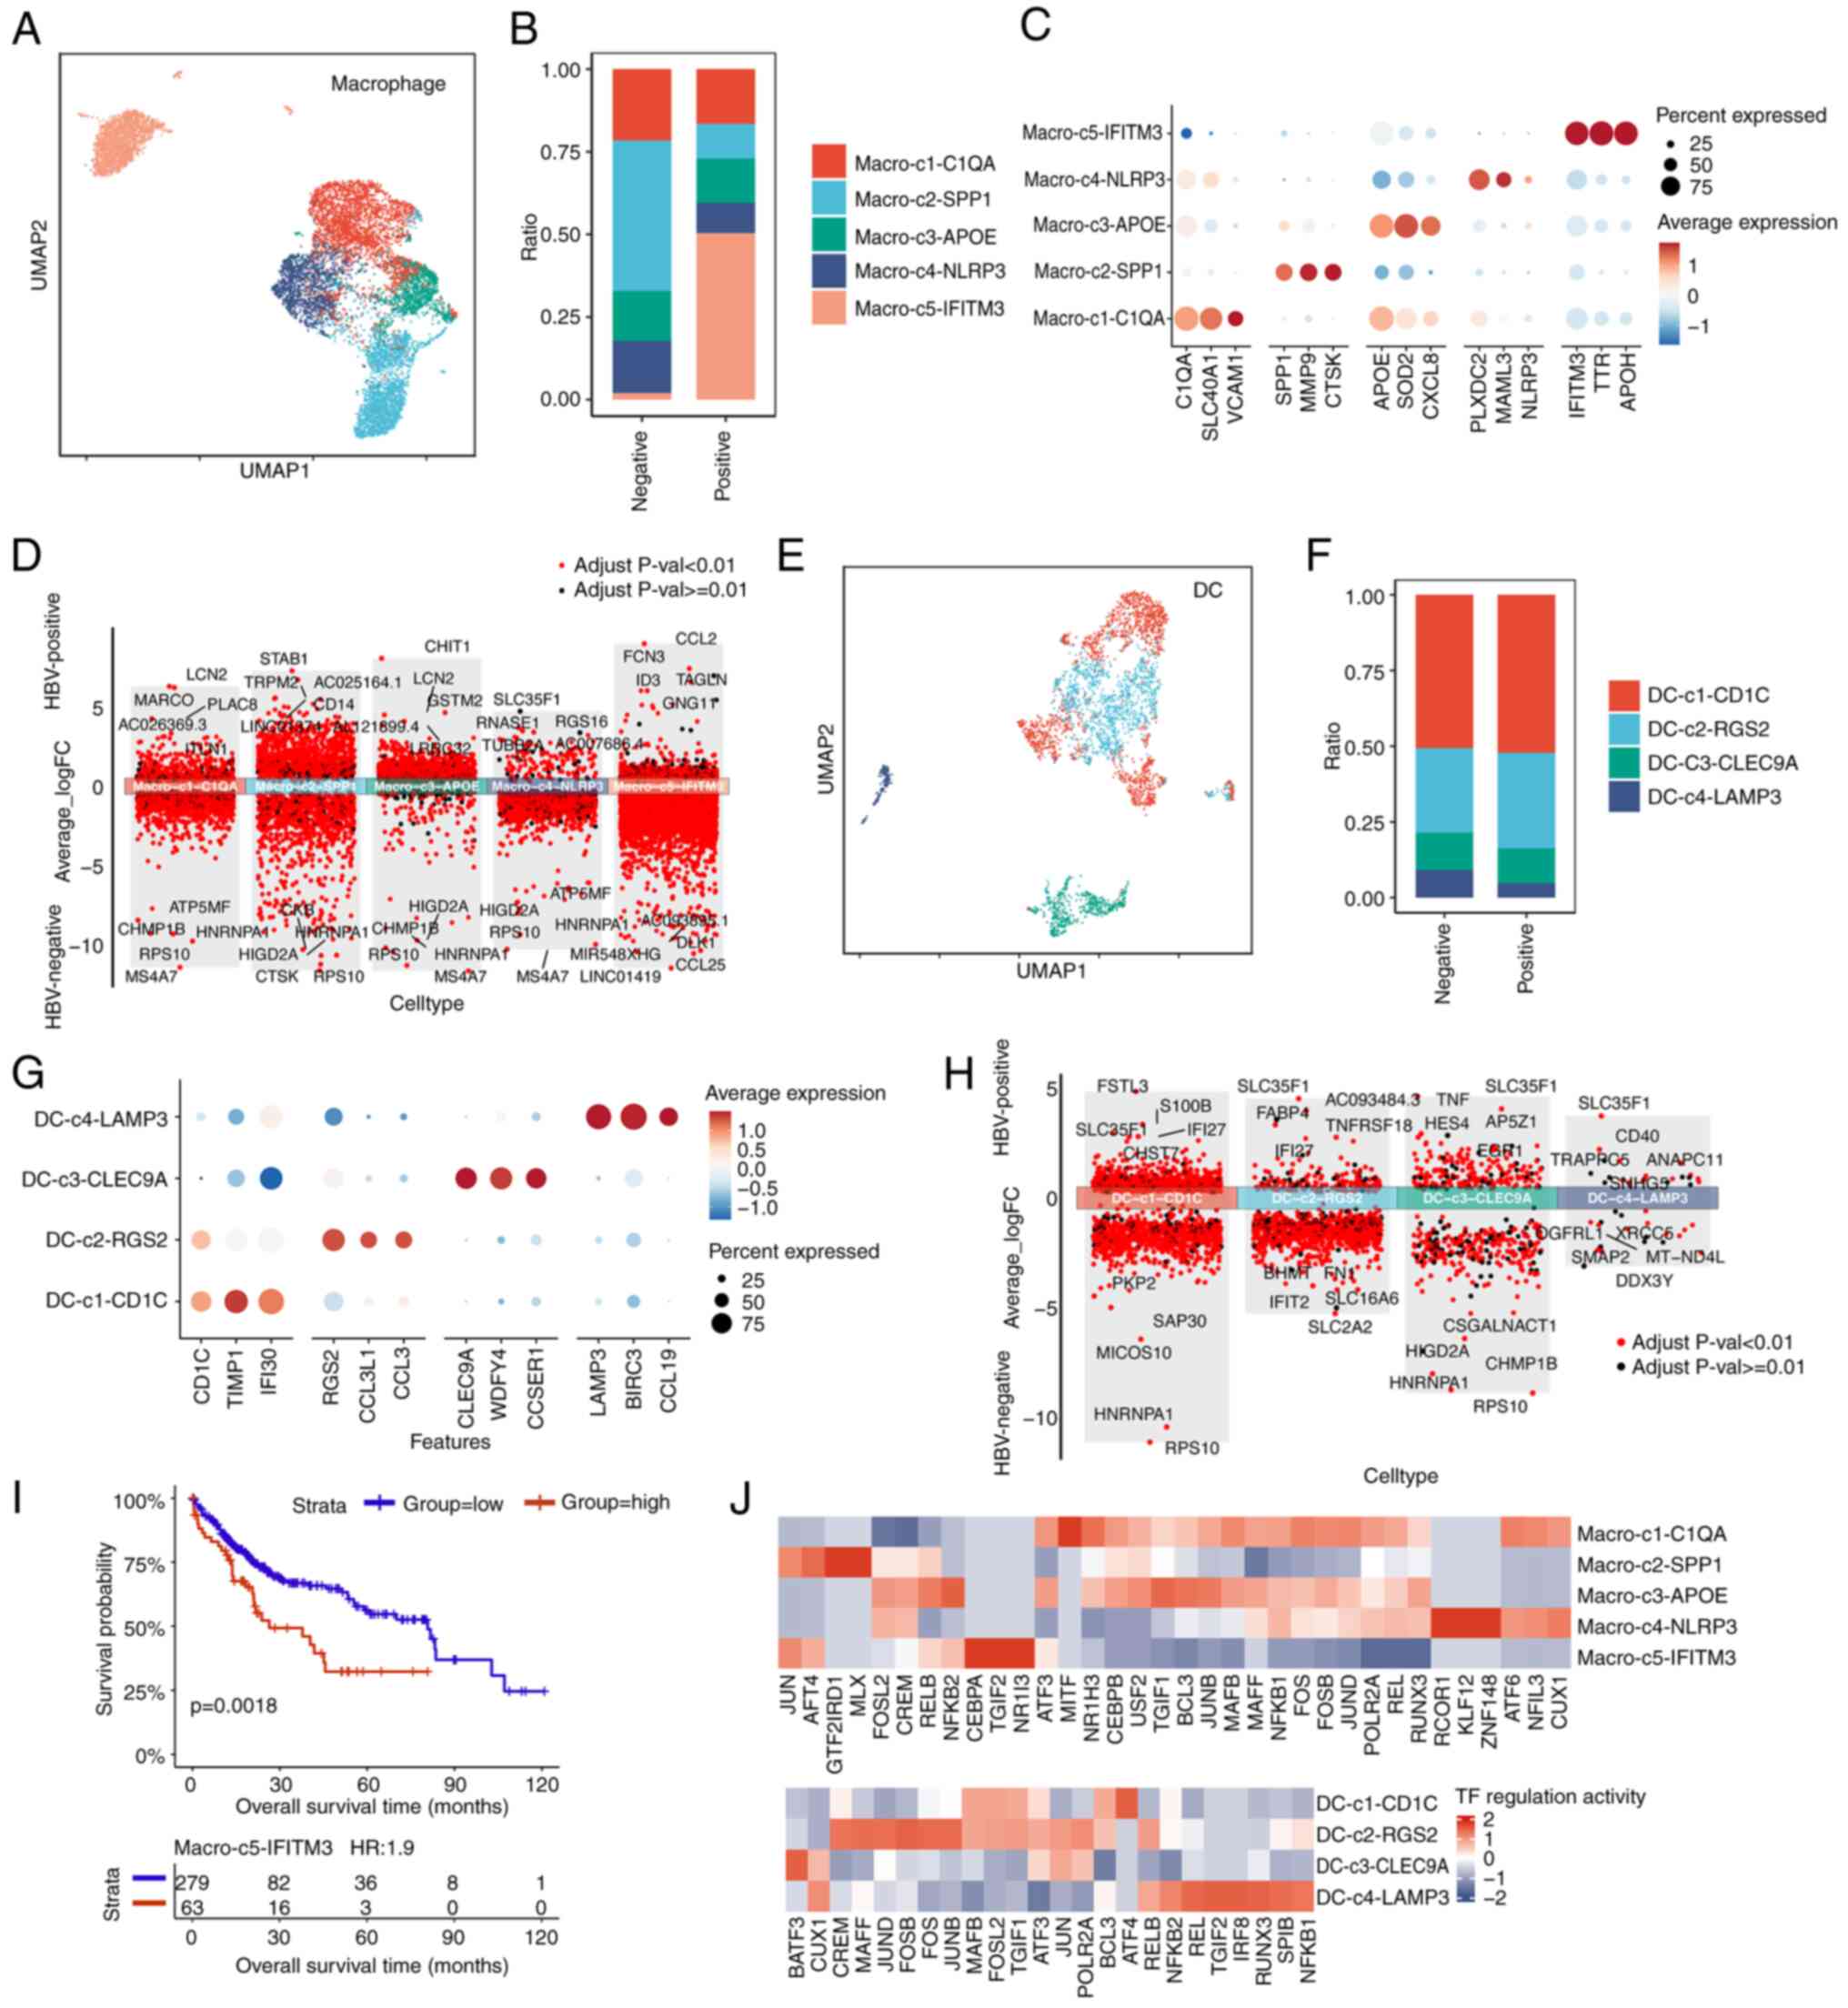
Macrophages and DCs are integral components of the tumor immune microenvironment, having key roles in immune regulation and interactions with other immune cells (32). To investigate the heterogeneity of these myeloid populations in HCC, scRNA-seq data from HBV-infected and non-HBV-infected samples were analyzed. Macrophages are essential for regulating inflammation, tumor immunity and tissue remodeling, and their phenotype and function may be altered by chronic HBV infection. Via unsupervised clustering analysis, five distinct macrophage subtypes were identified (Fig. 4A). The distribution of these subtypes varied between HBV-infected and non-HBV-infected samples, suggesting that HBV infection reshapes the macrophage landscape in HCC (Figs. 4B and S4E). To improve understanding of the functional roles of these subtypes, marker gene analysis was performed, which revealed distinct immune functions across the macrophage populations (Fig. 4C). The data revealed that the proportion of IFITM3+ macrophages was evidently increased, whereas that of SPP1+ macrophages was decreased, upon HBV infection (Fig. 4B). The higher proportion of IFITM3+ macrophages within HBV-positive tumors was further validated by immunofluorescence assay (Fig. S4F). IFITM3 is an IFN-induced antiviral protein that inhibits the entry of viruses (30). Therefore, an increase in the population of IFITM3+ macrophages may be indicative of an increase in the innate antiviral response upon HBV infection. Additionally, the population of SPP1+ macrophages expands under hypoxic conditions, and this may consequently enhance epithelial-mesenchymal transformation (EMT), thereby promoting tumor invasion and metastasis. Taken together, these results suggest that these two subtypes of macrophages may be associated with HBV-infection status and have different effects on tumor progression. To further compare differences in the macrophage subtypes, DEG analysis was performed comparing between the HBV-positive and HBV-negative groups. Interestingly, the results obtained demonstrated that the SLC35F1 gene was only significantly upregulated in the macro-c4-NLRP3 subtype (Fig. 4D), a finding that differed from the DEG results in T cells analyzed above, suggesting that the SLC35F1 gene may be an important mediator or functional gene responsive to HBV infection in this subtype.
DCs are key antigen-presenting cells that are vital for the initiation and regulation of T cell responses. In the present study, the DCs were classified into four subtypes, representing various maturation stages and specialized functions (Fig. 4E). Differences in the distribution of DC subtypes between HBV-infected and non-HBV-infected samples suggested that HBV infection may impair DC-mediated antigen presentation and subsequent immune activation (Figs. 4F and S4G). It was also shown that, upon HBV infection, the proportion of RGS2+ DCs was increased, whereas that of LAMP3+ DCs was decreased (Fig. 4F). RGS+ DCs were correlated with the level of immune cell infiltration, and were also positively correlated with the numbers of most immune cell types (33). HBV infection increased the proportion of RGS+ DCs, demonstrating that HBV significantly promotes immune cell infiltration. LAMP3+ DCs are able to inhibit the proliferation and function of CD8+ T cells, to recruit Treg cells, and to promote T cell exhaustion (34). The lower proportion of LAMP3+ DCs that result from HBV infection may result from the antiviral immune response. The functionality of these DC subtypes was further evaluated by analyzing the expression of key activating and co-stimulatory markers, which demonstrated that they have differing capacities to stimulate antitumor immune responses (Fig. 4G). Similarly, DEG analysis was performed to compare the differences of the DC subtypes with or with HBV infection. These results also highlighted upregulation of the gene SLCF351 upon HBV infection (Fig. 4H).
To assess the clinical relevance of macrophage heterogeneity, a survival analysis was performed using data from the TCGA-LIHC dataset. It was observed that an increased infiltration of the macrophage subtype macro-c5-IFITM3 was associated with poorer overall survival (P=0.0018; Fig. 4I). These results suggested that an imbalance favoring immune-suppressive macrophages may negatively affect patient outcomes in HCC. In particular, the evidently high proportion of IFITM3+ macrophages upon HBV infection may account for the lower survival rate of HCC. Subsequently, transcriptional regulation was further explored in the macrophage macro-c5-IFITM3 subtype using pySCENIC, which led to the identification of CEBPA, TGIF2 and NR1I3 as the active TFs (Fig. 4J).
In conclusion, the present analysis has revealed distinct macrophage and DC subtypes in HCC that are associated with patient survival, with the macro-c5-IFITM3 subtype being linked to poorer outcomes. TF analysis highlighted key regulators that drive these immune cell states, providing a more comprehensive understanding of the immune landscape in HBV-infected and non-HBV-infected HCC, which led to the identification of SLC35F1 and IFITM3 as potential targets for improving the immune response in HCC.
HBV infection shapes the cell-cell communication of HCC
To understand the impact of HBV infection on intercellular communication within HCC samples, differential cell-cell communication analyses were performed. Totals of 22,656 significant ligand-receptor (L-R) interactions in non-HBV-infected HCC, and 20,049 L-R interactions in HBV-infected HCC, were identified (Fig. 5A, left panel). The total strengths of these interactions were found to be 586.425 and 599.8 for non-HBV-infected HCC and HBV-infected HCC, respectively (Fig. 5A, right panel). Although the overall number of L-R interactions in tumor liver tissues was decreased due to HBV infection, HBV infection exhibited distinct effects on various cell-cell communication patterns. For example, the interactions between endothelial cells and fibroblasts and macro-C3-APOE were enhanced in HBV-infected tissues, whereas the incoming signaling interactions of NK cells decreased (Fig. S5). Additionally, it was observed that HBV infection caused increases in the incoming signals for monocytes, DCs and CD8 T cells (Fig. 5B). Collectively, these findings underscored the substantial impact of HBV infection on intercellular communication within the TME.
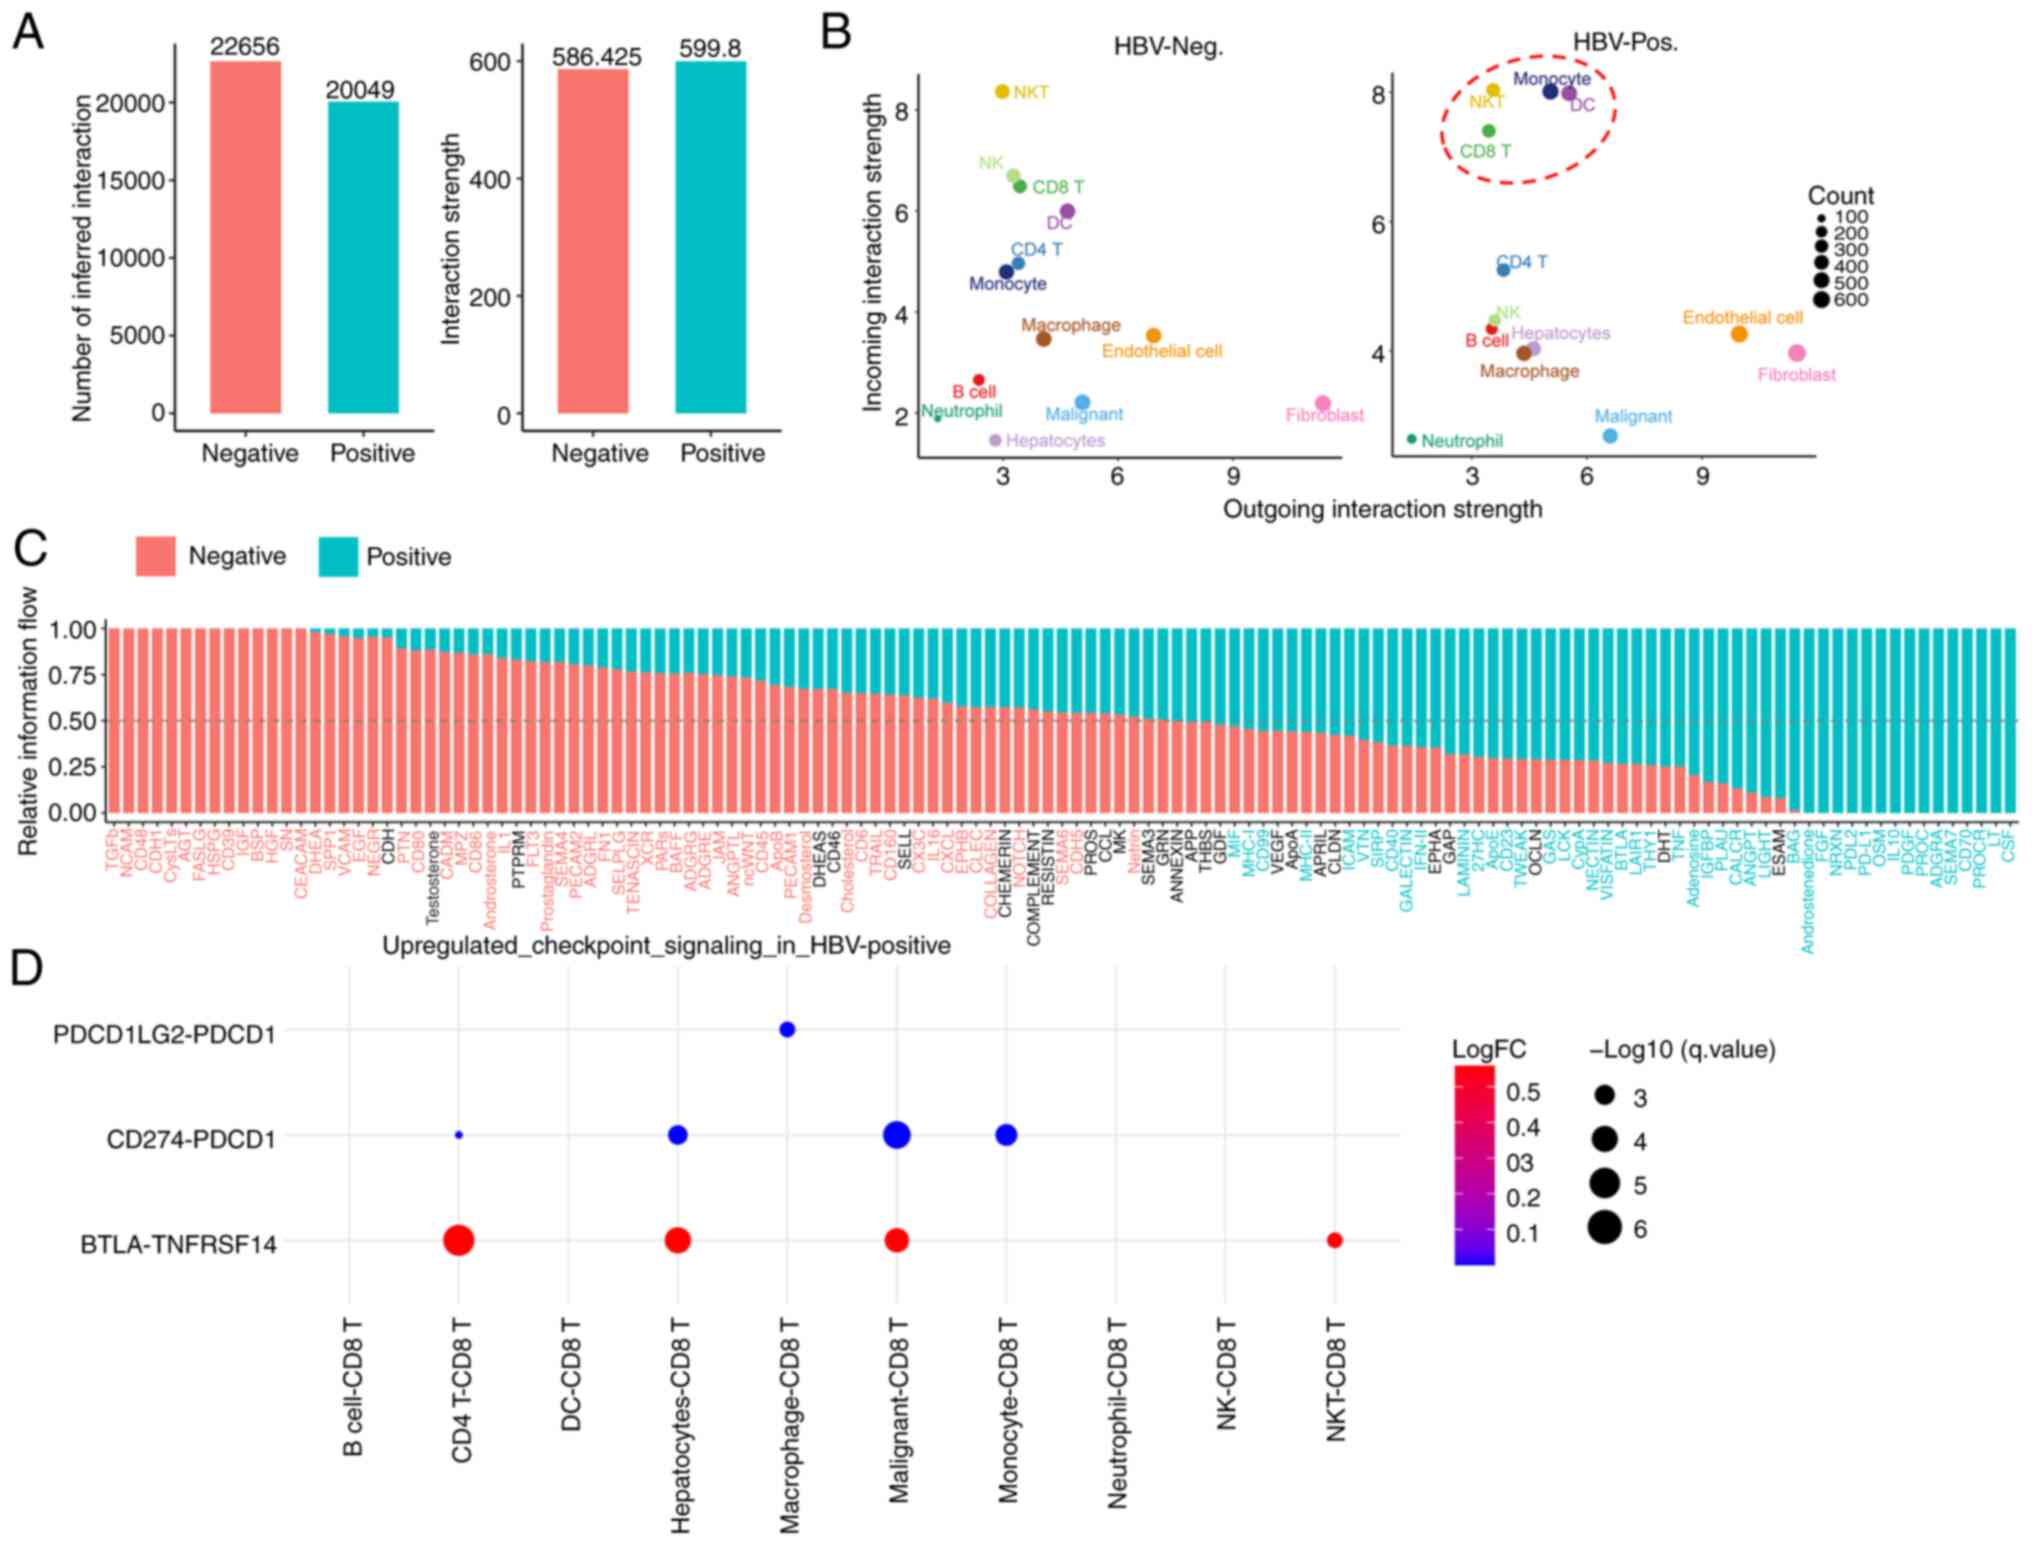
Subsequently, it was explored how HBV infection could influence incoming and outgoing signaling through calculating the distance between these pathways based on functional similarity. The ADGRG, GRN and CD86 signaling pathways were identified as the top three pathways affected by HBV (Fig. S6). In addition, in terms of information flow, the results identified four types of information flow to exist; namely, HBV-negative specific flow, HBV-negative biased flow, HBV-positive biased flow and HBV-positive specific flow (Fig. 5C), which provided a comprehensive overview of communication signaling flow.
As aforementioned, HBV infection enhanced CD8+ T cell exhaustion, as evidenced by the significantly increased expression of the exhaustion markers LAG3, PDCD1 and TIGIT (Fig. 3H). However, there was still a need to identify the specific cell types or L-R signaling pairs that mediated this exhaustion process. To address this issue, the interactions between CD8+ T cells and other immune cells was investigated, including interactions with malignant tumor cells, with a focus on examining outgoing checkpoint signaling targeting CD8+ T cells. This analysis revealed that three checkpoint signaling pathways, namely the PDCD1LG2-PDCD1, CD274-PDCD1 and BTLA-TNFRSF14 pathways, were significantly upregulated under HBV-infected conditions compared with HBV-non-infected conditions (Fig. 5D). Furthermore, the data identified that, although CD4+ T cells, hepatocytes and malignant tumor cells primarily contribute BTLA and CD274 ligands, macrophages are the exclusive source of the suppressive PDCD1LG2 ligand (Fig. 5D). Collectively, this cell-cell communication analysis has suggested that HBV infection contributes to CD8+ T cell exhaustion through increasing suppressive interactions with other cell types in the TME altered by HBV.
Discussion
The onset and progression of tumors, including HCC, are significantly influenced by the immune microenvironment (35,36). Previously, single-cell sequencing technology has been used to reveal the immune microenvironment characteristics of various types of tumor, providing novel strategies for immunotherapy (16-20,27,37). In the context of HCC, several single-cell omics studies have explored the immune profile within tumors, revealing novel T-cell subsets and demonstrating the immunosuppressive environment and tumor heterogeneity (18,19,27,38). It is noteworthy that patients with HCC often have HBV infections, a risk factor that inevitably affects the immune system (6). In principle, HBV infection alters the immune microenvironment, which will impact tumorigenesis and progression. However, at present, this important issue has not been thoroughly addressed. In the present study, a comparative analysis of the immune microenvironments in patients with HCC with and without HBV infection was performed. It was found that HBV infection significantly alters the TME, placing it into a more suppressed and exhausted state. This discovery provides valuable insights into the immunological mechanisms through which HBV infection contributes to HCC development, paving the way for novel immunotherapeutic strategies.
T cells and NK cells are important immune cells that play a key role in antitumor immunity. In the present study, it was found that there was a lower proportion of T/NK cells in tumor tissue compared with adjacent tissue (Fig. 1E). Since T cells are primarily involved in cellular immunity and are able to recognize and attack infected cells or cancer cells, while NK cells are a type of innate lymphoid cell with the ability to directly eliminate certain tumor cells and virus-infected cells without prior sensitization (39), this reflects an immunosuppressive feature of tumor. This may be due to the existence of multiple immunosuppressive mechanisms in tumor tissues, such as the expression of immune checkpoint molecules, the role of tumor-associated fibroblasts and the hypoxia microenvironment (40). In summary, the high proportion of T cells and NK cells in the peripheral tissues of tumors may reflect the recognition and response of the immune system to tumors, but the immunosuppressive mechanism within tumor tissues may limit the invasion and function of immune cells.
Moreover, it was also revealed that HBV infection promotes the increase of T/NK cells ratio within tumors (Fig. 2C), which suggests that HBV infection could change the immune microenvironment feature inside tumor tissue. HBV infection can reshape the TME through multiple mechanisms, which in turn affect the number and function of T cells inside the tumor. Firstly, HBV viral proteins are capable of interacting with a variety of molecules of tumor and immune cells. For example, HBx protein can induce EMT of tumor cells by activating the TGF-β signaling pathway, thereby altering the TME (41). In addition, HBx protein can inhibit the activity of T cells by upregulating the expression of PD-L1(42). Secondly, HBV infection can attract more T cells into tumor tissue through chronic inflammatory response; on the other hand, HBV infection may also lead to an increase in immunosuppressive cells (such as regulatory T cells), myeloid suppressor cells, thereby inhibiting T cell activity (43). Thirdly, HBV can alter cytokine levels in the TME. HBV-mediated activation of the TGF-β signaling pathway can promote immune escape of tumor cells. In addition, HBV infection may further inhibit T cell activity by upregulating the expression of certain immunosuppressive cytokines, such as IL-10(44). In summary, HBV infection remodels the TME through multiple mechanisms, including the role of viral proteins, the formation of immunosuppressive microenvironment, chronic inflammation and immune escape. These mechanisms work together to increase the number of T cells inside the tumor, but at the same time inhibit the activity of T cells, making them unable to effectively play an antitumor role. Therefore, for the treatment of HBV-related tumors, it is necessary to consider these mechanisms comprehensively to develop more effective immunotherapy strategies.
scRNA-seq results also helped us to identify some remarkably changed subtypes of T cells within tumors upon HBV infection. A marked increase was found in the proportion of MAIT cells, characterized by the expression of SLC4A10 and CD8, among the infiltrating T cells in HBV-positive HCC versus HBV-negative HCC. Since SLC4A10 is involved in the regulation of cellular pH value (45), the appropriate pH environment is the basis for the normal function of T cells, and excessive acidic environment will inhibit the effector function of T cells (46). Thus, SLC4A10+ MAIT cells might reshape the acidic immune microenvironment of tumor tissue and change the lytic activity of effector CD8+ T cells and their ability to eliminate tumor cells. Unlike conventional αβ+ CD8+ T cells that detect peptide antigens via MHC class I, MAIT cells recognize metabolites derived from microbes, which are presented by the MHC class I-associated protein, MR1 (47,48). Although previous studies have shown the potential antitumor activity of MAIT cells, demonstrating their cytolytic activity against tumor cells in vitro under certain conditions (49,50), previous in vivo findings have suggested that MAIT cells could actually facilitate the initiation, growth and metastasis of tumors (51,52). This tumor-promoting effect is considered to result from MAIT cells inhibiting the functions of T cells and/or NK cells. Therefore, our hypothesis was that a rise in MAIT cell proportion triggered by HBV infection may contribute to the progression of HCC. Consequently, targeting MAIT cells in HBV-associated HCC could potentially ss a novel immunotherapeutic strategy.
An increase in the proportion of IFITM3+ macrophages was also identified in HBV-positive samples. IFITM3, the interferon-induced transmembrane protein, is an important innate immune effector for the prevention of multiple viral infections in vertebrates. It is mainly located in the cellular endosome and lysosome, and exerts an antiviral effect by regulating the rigidity of endosome cell membrane to limit viral fusion (53). At the same time, it has also been reported that IFITM3 can restrict the replication of viruses inside macrophages (54). In addition, IFITM3 can also limit the production of virus-mediated inflammatory factors, thereby reducing viral pathological responses (55). Therefore, the increase of IFITM3+ macrophages is likely to be an innate antiviral response upon HBV infection.
Interestingly, a gene was identified, SLC35F1, that is significantly upregulated in various immune cells within HBV-positive HCC. The SLC35F1 gene belongs to the solute transport protein family (SLC) (56), which is mainly responsible for the membrane transport of various metabolites (such as glucose, amino acids and lipids) and the maintenance of the intracellular environment (such as nutrient uptake, ion inflow/outflow and waste disposal). SLCs and their corresponding transport substrates are critical to the inventory and function of immune cells, and different SLC subtypes mediate the transport of various substrates, such as glucose transporter (SLC2A1, SLC16A1/4) and amino acid transporter (SLC7A5, SLC38A1). These SLC proteins promote metabolic reprogramming of immune cells by regulating various metabolic substrates such as sugars, amino acids and lipids, thereby controlling the function and differentiation of immune cells and affecting the immune characteristics of the TME (57). For example, researchers found that SLC6A8 transporter mediated creatine regulation of macrophage polarization (58). In 2020, Bian et al (59) discovered that tumors compete for methionine from T cells through SLC43A2, thereby affecting methionine metabolism and histone methylation modification of T cells. Particularly, SLC35F1 was mainly found to be highly expressed in mouse brain and kidney tissues, localized in synaptic membrane and endosome of nerve cells (60). In addition, SLC35 family protein was reported to mediate the transport of nucleotide sugars across biological membranes (23,24), suggesting that SLC35F1 may fulfill a potential role in the transport and metabolism of nucleosides. In the complex TME, nucleotide metabolism substantially influences various immune cells, modulating their functions and shaping the cancer immunity landscape (61,62). For example, it could promote the functional activation of multiple immune cells and facilitating the interaction between immune cells through metabolism, so as to synergistically produce antiviral or antitumor immune effects. Although the specific role of SLC35F1 and the mechanism behind its upregulation due to HBV infection require further investigation, it is possible that the influence of HBV infection on the TME is mediated through SLC35F1. Therefore, SLC35F1 may be a potential target for modulating the immune microenvironment in HBV-positive HCC.
It should be noted that there were several limitations associated with the present study. First, the sample size was somewhat small, comprising only three cases each of HBV-positive and HBV-negative patients. Additionally, all patients with HCC included in the present study were at TNM stage I, which may limit the generalization of our findings and conclusions to patients who have more advanced stages of liver cancer. Thirdly, the study was mainly based on scRNA-seq; therefore, future studies will be necessary to validate these findings through wet lab experiments using patient samples to enhance the robustness of the conclusions.
In conclusion, our scRNA-seq analysis elucidates the profound impact of HBV infection on the immune microenvironment of HCC, revealing intricate mechanisms that drive immunosuppression and tumor progression. The identification of distinct immune cell subsets, such as MAIT cells and IFITM3+ macrophages, and the upregulation of key genes such as SLC35F1, underscore the complexity of the HBV-induced immune landscape. These findings not only enhance our understanding of the immunological basis of HBV-related HCC but also highlight potential therapeutic targets for immunomodulation. Future research should focus on validating these observations in larger cohorts and exploring the translational potential of targeting these pathways to develop more effective immunotherapies for patients with HBV-associated liver cancer.
Supplementary Material
Sample information and clustering annotation in primary HCC and non-tumor liver tissues. (A) Sample information sheet of HCC or HCC-adjacent tissues from six patients with HCC. (B) Violin plot, showing the detected genes across the samples after quality control. (C) UMAP plots, showing the identification of 11 clusters according to the unsupervised clustering method. (D) Dot plot, showing the marker genes expression of 11 clusters. HCC, hepatocellular carcinoma; UMAP, Unsupervised Uniform Manifold Approximation and Projection.
Changes in immune cell type proportions and SLC35F1 expression among various types of immune cells following HBV infection. (A) Stacked bar plots, summarizing the proportions of major cell types in Ne and Po samples. (B) Dot plot, displaying the expression levels of marker genes across 13 annotated clusters. (C) Representative immunostaining images showing CD45 (red) and SLC35F1 (green) in Ne and PO hepatocellular carcinoma tissue sections. Cell nuclei were stained with DAPI (blue). The quantification is shown on the right of the panel (n=9 sections from three patients; mean ± SEM). Statistical significance was calculated using unpaired two-tailed Student's t-test. ****P<0.0001. Scale bar, 30 μm. HBV, hepatitis B virus; Ne, HBV-negative; Po, HBV-positive; DC, dendritic cells; NK, natural killer cells.
Pathway and functional enrichment analyses of differentially expressed genes in immune cells within HCC upon HBV infection. (A) Bar plot, showing upregulated and downregulated GO terms associated with HBV infection. (B) Dot plot, highlighting the upregulated and downregulated KEGG pathways in HBV-infected samples. (C) Gene set enrichment analysis plot, illustrating altered KEGG pathways between HBV-positive and HBV-negative samples. The P-values in (A-C) were calculated using the hypergeometric test, with Benjamini-Hochberg adjustment. HCC, hepatocellular carcinoma; HBV, hepatitis B virus; GO, Gene Ontology; Kyoto Encyclopedia of Genes and Genomes.
Proportions of immune cell subtypes across individual patients. (A) Bar plots, illustrating the distribution of CD4+ T cell subtypes across each sample. (B) Bar plots, depicting the distribution of CD8+ T cell subtypes across each sample. (C) Dot plot, displaying the percentages of cells expressing marker genes alongside their average expression levels across CD8+ T cell subtypes. (D) Representative images of immunostaining for CD8 (red) and SLC4A10 (green) in Ne and Po HCC tissue sections. Cell nuclei were stained with DAPI (blue). The quantification is shown on the right of the panel (n=9 sections from three patients; mean ± SEM). (E) Bar plots, showing the proportions of macrophage subtypes across each sample. (F) Representative immunostaining images, showing CD68 (red) and IFITM3 (green) in Ne and Po HCC sections. Cell nuclei were stained with DAPI (blue). The quantification is shown on the right of the panel (n=9 sections from three patients; mean ± SEM). (G) Bar plots presenting the proportions of DC subtypes across each sample. Statistical significance in (D and F) was calculated via unpaired two-tailed Student's t-test. *P<0.05. Scale bar, 30 μm. HBV, hepatitis B virus; Ne, HBV-negative; Po, HBV-positive; HCC, hepatocellular carcinoma; DC, dendritic cells.
Effect of HBV infection on intercellular communication within tumor liver tissues across all identified cell subtypes. Increased intercellular communication is represented in red, whereas decreased communication is shown in blue. HBV, hepatitis B virus.
Identifying the effect of HBV infection on signaling networks within tumor liver tissues. Bar plot showing the pathway distance in HBV-positive versus HBV-negative effects. Only pathway distances >1 were shown. HBV, hepatitis B virus.
Acknowledgements
Not applicable.
Funding
Funding: The present study was supported by the National Key R&D Program of China (grant no. 2023YFA0915400), the National Natural Science Foundation of China (grant nos. 32371450 and 82303446), the Natural Science Foundation of Guangdong (grants nos. 2024A1515011562, 2023B1515040008 and 2023A1515220200), the Medical Scientific Research Foundation of Guangdong (grant no. A2024351), the Shenzhen Science and Technology Program (grant nos. JCYJ20210324120200001, JCYJ20210324101805014 and JCYJ20220818100807016), the Shenzhen High-level Hospital Construction Fund (grant no. KYQD2023303) and Peking University Shenzhen Hospital Scientific Research Fund.
Availability of data and materials
The data generated in the present study may be found in the Gene Expression Omnibus under accession number GSE282701or at the following URL: https://www.ncbi.nlm.nih.gov/geo/query/acc.cgi?acc=GSE282701. The data generated in the present study may be requested from the corresponding author.
Authors' contributions
HL, XS and DY conceived the project and supervised the study. EC collected specimens and clinical information. KL and JL prepared samples for single cell RNA-sequencing. KL, JL and YL analyzed single-cell RNA-sequencing data. BC, WS, ZZ, WZ and HT provided special technical support and discussed the data. KL, EC, XS and HL confirm the authenticity of all the raw data. KL, XS, DY and HL wrote the manuscript. All authors read and approved the final version of the manuscript.
Ethics approval and consent to participate
The present study was approved (approval no. 2022-164) by the Ethics Committee of Peking University Shenzhen Hospital (Shenzhen, China). Written informed consent was obtained by all involved patients.
Patient consent for publication
Not applicable.
Competing interests
The authors declare that they have no competing interests.
Use of artificial intelligence tools
During the preparation of this work, artificial intelligence tools were used to improve the readability and language of the manuscript or to generate images, and subsequently, the authors revised and edited the content produced by the artificial intelligence tools as necessary, taking full responsibility for the ultimate content of the present manuscript.
References
|
Llovet JM, Kelley RK, Villanueva A, Singal AG, Pikarsky E, Roayaie S, Lencioni R, Koike K, Zucman-Rossi J and Finn RS: Hepatocellular carcinoma. Nat Rev Dis Primers. 7(6)2021.PubMed/NCBI View Article : Google Scholar | |
|
Singal AG, Kanwal F and Llovet JM: Global trends in hepatocellular carcinoma epidemiology: Implications for screening, prevention and therapy. Nat Rev Clin Oncol. 20:864–884. 2023.PubMed/NCBI View Article : Google Scholar | |
|
Singal AG, Lampertico P and Nahon P: Epidemiology and surveillance for hepatocellular carcinoma: New trends. J Hepatol. 72:250–261. 2020.PubMed/NCBI View Article : Google Scholar | |
|
El-Serag HB: Hepatocellular carcinoma. N Engl J Med. 365:1118–1127. 2011.PubMed/NCBI View Article : Google Scholar | |
|
Yue B, Gao Y, Hu Y, Zhan M, Wu Y and Lu L: Harnessing CD8(+) T cell dynamics in hepatitis B virus-associated liver diseases: Insights, therapies and future directions. Clin Transl Med. 14(e1731)2024.PubMed/NCBI View Article : Google Scholar | |
|
Iannacone M and Guidotti LG: Immunobiology and pathogenesis of hepatitis B virus infection. Nat Rev Immunol. 22:19–32. 2022.PubMed/NCBI View Article : Google Scholar | |
|
He J, Miao R, Chen Y, Wang H and Liu M: The dual role of regulatory T cells in hepatitis B virus infection and related hepatocellular carcinoma. Immunology. 171:445–463. 2024.PubMed/NCBI View Article : Google Scholar | |
|
Weber C: Hepatitis: Myeloid-derived suppressor cells in HBV infection. Nat Rev Gastroenterol Hepatol. 12(370)2015.PubMed/NCBI View Article : Google Scholar | |
|
Ye B, Liu X, Li X, Kong H, Tian L and Chen Y: T-cell exhaustion in chronic hepatitis B infection: current knowledge and clinical significance. Cell Death Dis. 6(e1694)2015.PubMed/NCBI View Article : Google Scholar | |
|
Dumolard L, Aspord C, Marche PN and Jilkova ZM: Immune checkpoints on T and NK cells in the context of HBV infection: Landscape, pathophysiology and therapeutic exploitation. Front Immunol. 14(1148111)2023.PubMed/NCBI View Article : Google Scholar | |
|
Chen Y and Tian Z: HBV-Induced immune imbalance in the development of HCC. Front Immunol. 10(2048)2019.PubMed/NCBI View Article : Google Scholar | |
|
Liu L, Huang Y, Fu Y, Rao J, Zeng F, Ji M, Xu X, Zhu J, Du W and Liu Z: Hepatitis B virus promotes hepatocellular carcinoma development by activating GP73 to repress the innate immune response. Infect Agent Cancer. 17(52)2022.PubMed/NCBI View Article : Google Scholar | |
|
Jiang Y, Han Q, Zhao H and Zhang J: The mechanisms of HBV-induced hepatocellular carcinoma. J Hepatocell Carcinoma. 8:435–450. 2021.PubMed/NCBI View Article : Google Scholar | |
|
Zheng Q, Sun Q, Yao H, Shi R, Wang C, Ma Z, Xu H, Zhou G, Cheng Z and Xia H: Single-cell landscape identifies the immunophenotypes and microenvironments of HBV-positive and HBV-negative liver cancer. Hepatol Commun. 8(e0364)2024.PubMed/NCBI View Article : Google Scholar | |
|
Lambrechts D, Wauters E, Boeckx B, Aibar S, Nittner D, Burton O, Bassez A, Decaluwé H, Pircher A, Van den Eynde K, et al: Phenotype molding of stromal cells in the lung tumor microenvironment. Nat Med. 24:1277–1289. 2018.PubMed/NCBI View Article : Google Scholar | |
|
Azizi E, Carr AJ, Plitas G, Cornish AE, Konopacki C, Prabhakaran S, Nainys J, Wu K, Kiseliovas V, Setty M, et al: Single-cell map of diverse immune phenotypes in the breast tumor microenvironment. Cell. 174:1293–1308, e1236. 2018.PubMed/NCBI View Article : Google Scholar | |
|
Zhang L, Yu X, Zheng L, Zhang Y, Li Y, Fang Q, Gao R, Kang B, Zhang Q, Huang JY, et al: Lineage tracking reveals dynamic relationships of T cells in colorectal cancer. Nature. 564:268–272. 2018.PubMed/NCBI View Article : Google Scholar | |
|
Zhang Q, He Y, Luo N, Patel SJ, Han Y, Gao R, Modak M, Carotta S, Haslinger C, Kind D, et al: Landscape and dynamics of single immune cells in hepatocellular carcinoma. Cell. 179:829–845, e820. 2019.PubMed/NCBI View Article : Google Scholar | |
|
Zheng C, Zheng L, Yoo JK, Guo H, Zhang Y, Guo X, Kang B, Hu R, Huang JY, Zhang Q, et al: Landscape of infiltrating T cells in liver cancer revealed by single-cell sequencing. Cell. 169:1342–1356, e1316. 2017.PubMed/NCBI View Article : Google Scholar | |
|
Steele NG, Carpenter ES, Kemp SB, Sirihorachai VR, The S, Delrosario L, Lazarus J, Amir ED, Gunchick V, Espinoza C, et al: Multimodal mapping of the tumor and peripheral blood immune landscape in human pancreatic cancer. Nat Cancer. 1:1097–1112. 2020.PubMed/NCBI View Article : Google Scholar | |
|
Korsunsky I, Millard N, Fan J, Slowikowski K, Zhang F, Wei K, Baglaenko Y, Brenner M, Loh PR and Raychaudhuri S: Fast, sensitive and accurate integration of single-cell data with harmony. Nat Methods. 16:1289–1296. 2019.PubMed/NCBI View Article : Google Scholar | |
|
Van de Sande B, Flerin C, Davie K, De Waegeneer M, Hulselmans G, Aibar S, Seurinck R, Saelens W, Cannoodt R, Rouchon Q, et al: A scalable SCENIC workflow for single-cell gene regulatory network analysis. Nat Protoc. 15:2247–2276. 2020.PubMed/NCBI View Article : Google Scholar | |
|
Van den Bossche F, Tevel V, Gilis F, Gaussin JF, Boonen M and Jadot M: Residence of the nucleotide sugar transporter family members SLC35F1 and SLC35F6 in the endosomal/lysosomal pathway. Int J Mol Sci. 25(6718)2024.PubMed/NCBI View Article : Google Scholar | |
|
Song Z: Roles of the nucleotide sugar transporters (SLC35 family) in health and disease. Mol Aspects Med. 34:590–600. 2013.PubMed/NCBI View Article : Google Scholar | |
|
Ringelhan M, Pfister D, O'Connor T, Pikarsky E and Heikenwalder M: The immunology of hepatocellular carcinoma. Nat Immunol. 19:222–232. 2018.PubMed/NCBI View Article : Google Scholar | |
|
Bian J, Lin J, Long J, Yang X, Yang X, Lu X, Sang X and Zhao H: T lymphocytes in hepatocellular carcinoma immune microenvironment: Insights into human immunology and immunotherapy. Am J Cancer Res. 10:4585–4606. 2020.PubMed/NCBI | |
|
Ho DW, Tsui YM, Chan LK, Sze KM, Zhang X, Cheu JW, Chiu YT, Lee JM, Chan AC, Cheung ET, et al: Single-cell RNA sequencing shows the immunosuppressive landscape and tumor heterogeneity of HBV-associated hepatocellular carcinoma. Nat Commun. 12(3684)2021.PubMed/NCBI View Article : Google Scholar | |
|
Vodnala SK, Eil R, Kishton RJ, Sukumar M, Yamamoto TN, Ha NH, Lee PH, Shin M, Patel SJ, Yu Z, et al: T cell stemness and dysfunction in tumors are triggered by a common mechanism. Science. 363(eaau0135)2019.PubMed/NCBI View Article : Google Scholar | |
|
Sugimoto MA, Vago JP, Teixeira MM and Sousa LP: Annexin A1 and the resolution of inflammation: Modulation of neutrophil recruitment, apoptosis, and clearance. J Immunol Res. 2016(8239258)2016.PubMed/NCBI View Article : Google Scholar | |
|
Binder B, Thimme R and Hofmann M: MAIT cells in viral hepatitis and liver diseases. Crit Rev Immunol. 41:37–47. 2021.PubMed/NCBI View Article : Google Scholar | |
|
Gajewski TF, Schreiber H and Fu YX: Innate and adaptive immune cells in the tumor microenvironment. Nat Immunol. 14:1014–1022. 2013.PubMed/NCBI View Article : Google Scholar | |
|
Diamond MS and Farzan M: The broad-spectrum antiviral functions of IFIT and IFITM proteins. Nat Rev Immunol. 13:46–57. 2013.PubMed/NCBI View Article : Google Scholar | |
|
Reif K and Cyster JG: RGS molecule expression in murine B lymphocytes and ability to down-regulate chemotaxis to lymphoid chemokines. J Immunol. 164:4720–4729. 2000.PubMed/NCBI View Article : Google Scholar | |
|
Truxova I, Kasikova L, Hensler M, Skapa P, Laco J, Pecen L, Belicova L, Praznovec I, Halaska MJ, Brtnicky T, et al: Mature dendritic cells correlate with favorable immune infiltrate and improved prognosis in ovarian carcinoma patients. J Immunother Cancer. 6(139)2018.PubMed/NCBI View Article : Google Scholar | |
|
Fu Y, Guo X, Sun L, Cui T, Wu C, Wang J, Liu Y and Liu L: Exploring the role of the immune microenvironment in hepatocellular carcinoma: Implications for immunotherapy and drug resistance. Elife. 13(e95009)2024.PubMed/NCBI View Article : Google Scholar | |
|
Chen SM, Zhang L, Chen YK, Zhang XZ and Ma Y: Chronic inflammatory and immune microenvironment promote hepatocellular carcinoma evolution. J Inflamm Res. 16:5287–5298. 2023. | |
|
Ren X, Zhang L, Zhang Y, Li Z, Siemers N and Zhang Z: Insights gained from single-cell analysis of immune cells in the tumor microenvironment. Annu Rev Immunol. 39:583–609. 2021.PubMed/NCBI View Article : Google Scholar | |
|
Song G, Shi Y, Zhang M, Goswami S, Afridi S, Meng L, Ma J, Chen Y, Lin Y, Zhang J, et al: Global immune characterization of HBV/HCV-related hepatocellular carcinoma identifies macrophage and T-cell subsets associated with disease progression. Cell Discov. 6(90)2020.PubMed/NCBI View Article : Google Scholar | |
|
Sun JC and Lanier LL: NK cell development, homeostasis and function: Parallels with CD8(+) T cells. Nat Rev Immunol. 11:645–657. 2011.PubMed/NCBI View Article : Google Scholar | |
|
Tie Y, Tang F, Wei YQ and Wei XW: Immunosuppressive cells in cancer: Mechanisms and potential therapeutic targets. J Hematol Oncol. 15(61)2022.PubMed/NCBI View Article : Google Scholar | |
|
Sivasudhan E, Blake N, Lu Z, Meng J and Rong R: Hepatitis B viral protein HBx and the molecular mechanisms modulating the hallmarks of hepatocellular carcinoma: A comprehensive review. Cells. 11(741)2022.PubMed/NCBI View Article : Google Scholar | |
|
Sun Y, Yu M, Qu M, Ma Y, Zheng D, Yue Y, Guo S, Tang L, Li G, Zheng W, et al: Hepatitis B virus-triggered PTEN/beta-catenin/c-Myc signaling enhances PD-L1 expression to promote immune evasion. Am J Physiol Gastrointest Liver Physiol. 318:G162–G173. 2020.PubMed/NCBI View Article : Google Scholar | |
|
Shin EC, Sung PS and Park SH: Immune responses and immunopathology in acute and chronic viral hepatitis. Nat Rev Immunol. 16:509–523. 2016.PubMed/NCBI View Article : Google Scholar | |
|
Donne R and Lujambio A: The liver cancer immune microenvironment: Therapeutic implications for hepatocellular carcinoma. Hepatology. 77:1773–1796. 2023.PubMed/NCBI View Article : Google Scholar | |
|
Hu MY, Yan JJ, Petersen I, Himmerkus N, Bleich M and Stumpp M: A SLC4 family bicarbonate transporter is critical for intracellular pH regulation and biomineralization in sea urchin embryos. Elife. 7(e36600)2018.PubMed/NCBI View Article : Google Scholar | |
|
Vuillefroy de Silly R, Pericou L, Seijo B, Crespo I and Irving M: Acidity suppresses CD8 + T-cell function by perturbing IL-2, mTORC1, and c-Myc signaling. EMBO J. 43:4922–4953. 2024.PubMed/NCBI View Article : Google Scholar | |
|
Treiner E, Duban L, Bahram S, Radosavljevic M, Wanner V, Tilloy F, Affaticati P, Gilfillan S and Lantz O: Selection of evolutionarily conserved mucosal-associated invariant T cells by MR1. Nature. 422:164–169. 2003.PubMed/NCBI View Article : Google Scholar | |
|
Le Bourhis L, Guerri L, Dusseaux M, Martin E, Soudais C and Lantz O: Mucosal-associated invariant T cells: Unconventional development and function. Trends Immunol. 32:212–218. 2011.PubMed/NCBI View Article : Google Scholar | |
|
Ling L, Lin Y, Zheng W, Hong S, Tang X, Zhao P, Li M, Ni J, Li C, Wang L and Jiang Y: Circulating and tumor-infiltrating mucosal associated invariant T (MAIT) cells in colorectal cancer patients. Sci Rep. 6(20358)2016.PubMed/NCBI View Article : Google Scholar | |
|
Gherardin NA, Loh L, Admojo L, Davenport AJ, Richardson K, Rogers A, Darcy PK, Jenkins MR, Prince HM, Harrison SJ, et al: Enumeration, functional responses and cytotoxic capacity of MAIT cells in newly diagnosed and relapsed multiple myeloma. Sci Rep. 8(4159)2018.PubMed/NCBI View Article : Google Scholar | |
|
Yan J, Allen S, McDonald E, Das I, Mak JYW, Liu L, Fairlie DP, Meehan BS, Chen Z, Corbett AJ, et al: MAIT cells promote tumor initiation, growth, and Metastases via Tumor MR1. Cancer Discov. 10:124–141. 2020.PubMed/NCBI View Article : Google Scholar | |
|
Petley EV, Koay HF, Henderson MA, Sek K, Todd KL, Keam SP, Lai J, House IG, Li J, Zethoven M, et al: MAIT cells regulate NK cell-mediated tumor immunity. Nat Commun. 12(4746)2021.PubMed/NCBI View Article : Google Scholar | |
|
Amini-Bavil-Olyaee S, Choi YJ, Lee JH, Shi M, Huang IC, Farzan M and Jung JU: The antiviral effector IFITM3 disrupts intracellular cholesterol homeostasis to block viral entry. Cell Host Microbe. 13:452–464. 2013.PubMed/NCBI View Article : Google Scholar | |
|
Londrigan SL, Wakim LM, Smith J, Haverkate AJ, Brooks AG and Reading PC: IFITM3 and type I interferons are important for the control of influenza A virus replication in murine macrophages. Virology. 540:17–22. 2020.PubMed/NCBI View Article : Google Scholar | |
|
Clement M, Forbester JL, Marsden M, Sabberwal P, Sommerville MS, Wellington D, Dimonte S, Clare S, Harcourt K, Yin Z, et al: IFITM3 restricts virus-induced inflammatory cytokine production by limiting Nogo-B mediated TLR responses. Nat Commun. 13(5294)2022.PubMed/NCBI View Article : Google Scholar | |
|
Pizzagalli MD, Bensimon A and Superti-Furga G: A guide to plasma membrane solute carrier proteins. FEBS J. 288:2784–2835. 2021.PubMed/NCBI View Article : Google Scholar | |
|
Song W, Li D, Tao L, Luo Q and Chen L: Solute carrier transporters: The metabolic gatekeepers of immune cells. Acta Pharm Sin B. 10:61–78. 2020.PubMed/NCBI View Article : Google Scholar | |
|
Ji L, Zhao X, Zhang B, Kang L, Song W, Zhao B, Xie W, Chen L and Hu X: Slc6a8-mediated creatine uptake and accumulation reprogram macrophage polarization via regulating cytokine responses. Immunity. 51:272–284, e277. 2019.PubMed/NCBI View Article : Google Scholar | |
|
Bian Y, Li W, Kremer DM, Sajjakulnukit P, Li S, Crespo J, Nwosu ZC, Zhang L, Czerwonka A, Pawłowska A, et al: Cancer SLC43A2 alters T cell methionine metabolism and histone methylation. Nature. 585:277–282. 2020.PubMed/NCBI View Article : Google Scholar | |
|
Farenholtz J, Artelt N, Blumenthal A, Endlich K, Kroemer HK, Endlich N and von Bohlen Und Halbach O: Expression of Slc35f1 in the murine brain. Cell Tissue Res. 377:167–176. 2019.PubMed/NCBI View Article : Google Scholar | |
|
Sulieman H, Emerson A, Wilson PM, Mulligan KA, Ladner RD and LaBonte MJ: Harnessing nucleotide metabolism and immunity in cancer: A tumour microenvironment perspective. FEBS J. 292:2155–2172. 2024.PubMed/NCBI View Article : Google Scholar | |
|
Madsen HB, Peeters MJ, Straten PT and Desler C: Nucleotide metabolism in the regulation of tumor microenvironment and immune cell function. Curr Opin Biotechnol. 84(103008)2023.PubMed/NCBI View Article : Google Scholar |