Clinical manifestations of Oropouche virus infection: A systematic review and meta‑analysis
- Authors:
- Published online on: August 27, 2025 https://doi.org/10.3892/mi.2025.266
- Article Number: 67
-
Copyright : © Giri et al. This is an open access article distributed under the terms of Creative Commons Attribution License [CC BY 4.0].
Abstract
Introduction
The Oropouche virus (OROV), an arbovirus of growing public health concern, is mainly spread through the bite of Culicoides paraensis midges, with mosquitoes playing a secondary role in transmission (1). OROV is a member of the Orthobunyavirus genus within the Peribunyaviridae family and possesses a segmented, single-stranded negative-sense RNA genome approximately 12.5 kb in length (1). The virus has been responsible for recurrent outbreaks of acute febrile illness across tropical and subtropical regions of Latin America, particularly in Brazil, Peru and the Amazon basin (2-4). First identified in Trinidad in 1955, the OROV has since been responsible for numerous human infections. Its transmission involves a zoonotic cycle, with sloths and primates serving as reservoirs, while humans are typically incidental hosts (1). Recent epidemiological surveillance indicates its expansion into previously unaffected geographic regions, raising significant concerns about its potential for broader dissemination (5).
The symptoms of Oropouche fever often mirror those of other arboviral infections, including dengue fever, chikungunya virus and Zika virus, posing challenges for accurate clinical differentiation in regions where these viruses co-circulate (1,6). The clinical presentation of OROV often features rapid fever development together with cephalgia, muscular pain, arthralgic symptoms and ocular photophobia. Neurological manifestations, such as cerebral inflammation or meningeal syndrome may occur in severe presentations (1,4). Although the OROV causes a substantial disease burden, it is often underdiagnosed and underreported, primarily due to restricted diagnostic capabilities and the similarity of its symptoms with other febrile conditions (7).
To date, no comprehensive synthesis of the clinical manifestations of OROV infection has been conducted across diverse outbreak settings and populations. The clinical spectrum of OROV infection remains incompletely characterized, necessitating a comprehensive synthesis of existing evidence. A systematic review and meta-analysis represent a critical approach to consolidating epidemiological and clinical data, which will facilitate the identification of predominant symptom patterns and their prevalence. Such an analysis is vital for refining diagnostic criteria and optimizing patient management in endemic regions.
The present aimed to systematically evaluate the clinical manifestations of OROV infection by conducting a meta-analysis of published literature. This research addresses existing knowledge gaps and strengthens evidence-based clinical and public health interventions by elucidating the symptomatic profile and disease burden. The findings provided herein may provide a foundation for improved case detection, surveillance, and therapeutic decision-making in areas affected by this emerging arbovirus.
Data and methods
The present systematic review and meta-analysis strictly adhered to the Preferred Reporting Items for Systematic Reviews and Meta-Analyses (PRISMA) guidelines (8).
Search strategy
For the search, two authors (MG and AP) independently performed a systematic literature search of electronic databases, including PubMed, Web of Science and Embase, to identify studies reporting the clinical manifestations of OROV infection from inception until April 9, 2025, without language restrictions. Both peer-reviewed and available preprint publications were considered for inclusion. A systematic literature search was independently conducted by two authors (MG and AP), using a combination of terms related to the Oropouche virus, including ‘Oropouche virus’, ‘Oropouche fever’, ‘Oropouche orthobunyavirus’, ‘Oropouche virus infection’, ‘Oropouche virus disease’, ‘Orthobunyavirus Oropouche’ and ‘OROV’. The detailed search strategy for each database is presented in Table SI. The references of relevant articles were manually reviewed to identify additional studies.
Eligibility criteria
The inclusion criteria for studies in the present systematic review and meta-analysis were as follows: i) Studies involving patients with laboratory-confirmed OROV infection, with confirmation established through RT-PCR or serological assays; ii) studies that provided detailed descriptions of the clinical features associated with OROV infection. Eligible study designs included cohort, case-control, cross-sectional studies and case series. The exclusion criteria were the following: i) Studies with <5 participants; ii) research conducted on animals; iii) non-original publications such as reviews, meta-analyses, commentaries, errata and other editorial content; and iv) studies lacking comprehensive clinical data.
Study selection and data extraction
Two authors (MG and AP) independently conducted study selection and data extraction. Titles and abstracts of all retrieved records were screened to determine eligibility according to predefined inclusion criteria. Any discrepancies were resolved through discussion, with input from a third reviewer when necessary. Data were extracted using pre-designed Excel forms for all studies meeting the eligibility criteria to ensure standardized and systematic collection. Extracted variables included study setting (country), study design, population characteristics, study period, sample size, diagnostic methods, and reported clinical manifestations.
Quality assessment
The methodological quality of the included observational studies was evaluated using a simplified and modified version of the Newcastle-Ottawa Scale (NOS) (9). This version assessed four key domains: The representativeness of the study population, adequacy of the sample size, clarity and validity of the diagnostic criteria used to confirm OROV infection, and the reliability of outcome ascertainment. Each study was assigned a total score ranging from 0 to 6, with studies categorized as low (score 0-2), moderate (score 3-4), or high quality (score 5-6). For case series and case reports, the methodological quality was evaluated according to the framework proposed in the study by Murad et al (10). The results of the quality appraisal for all included studies are presented in Tables SII and SIII.
Statistical analysis
All statistical analyses were performed using R software, version 4.4.1, with the ‘meta’ and ‘metafor’ packages for Windows. A Freeman-Tukey double arcsine transformation with a random-effects model was applied to compute the weighted proportion of clinical manifestations and corresponding 95% confidence intervals (CIs). Given the observed variability between the included studies, DerSimonian and Laird inverse-variance-weighted random-effects models were used. The I2 statistic and Cochran's Q test were used to assessed the heterogeneity of the included studies. The I2 values were categorized as low (<25%), moderate (25-75%) and high (>75%) to indicate the level of heterogeneity. Publication bias was evaluated visually via funnel plots and quantitatively using Begg's regression test. A sensitivity analysis was also performed through a leave-one-out meta-analysis to assess each study's effect on the overall pooled estimates. All statistical tests were two-sided, with P-values of less than 0.05 considered statistically significant.
Results
Search results and characteristics of the included studies
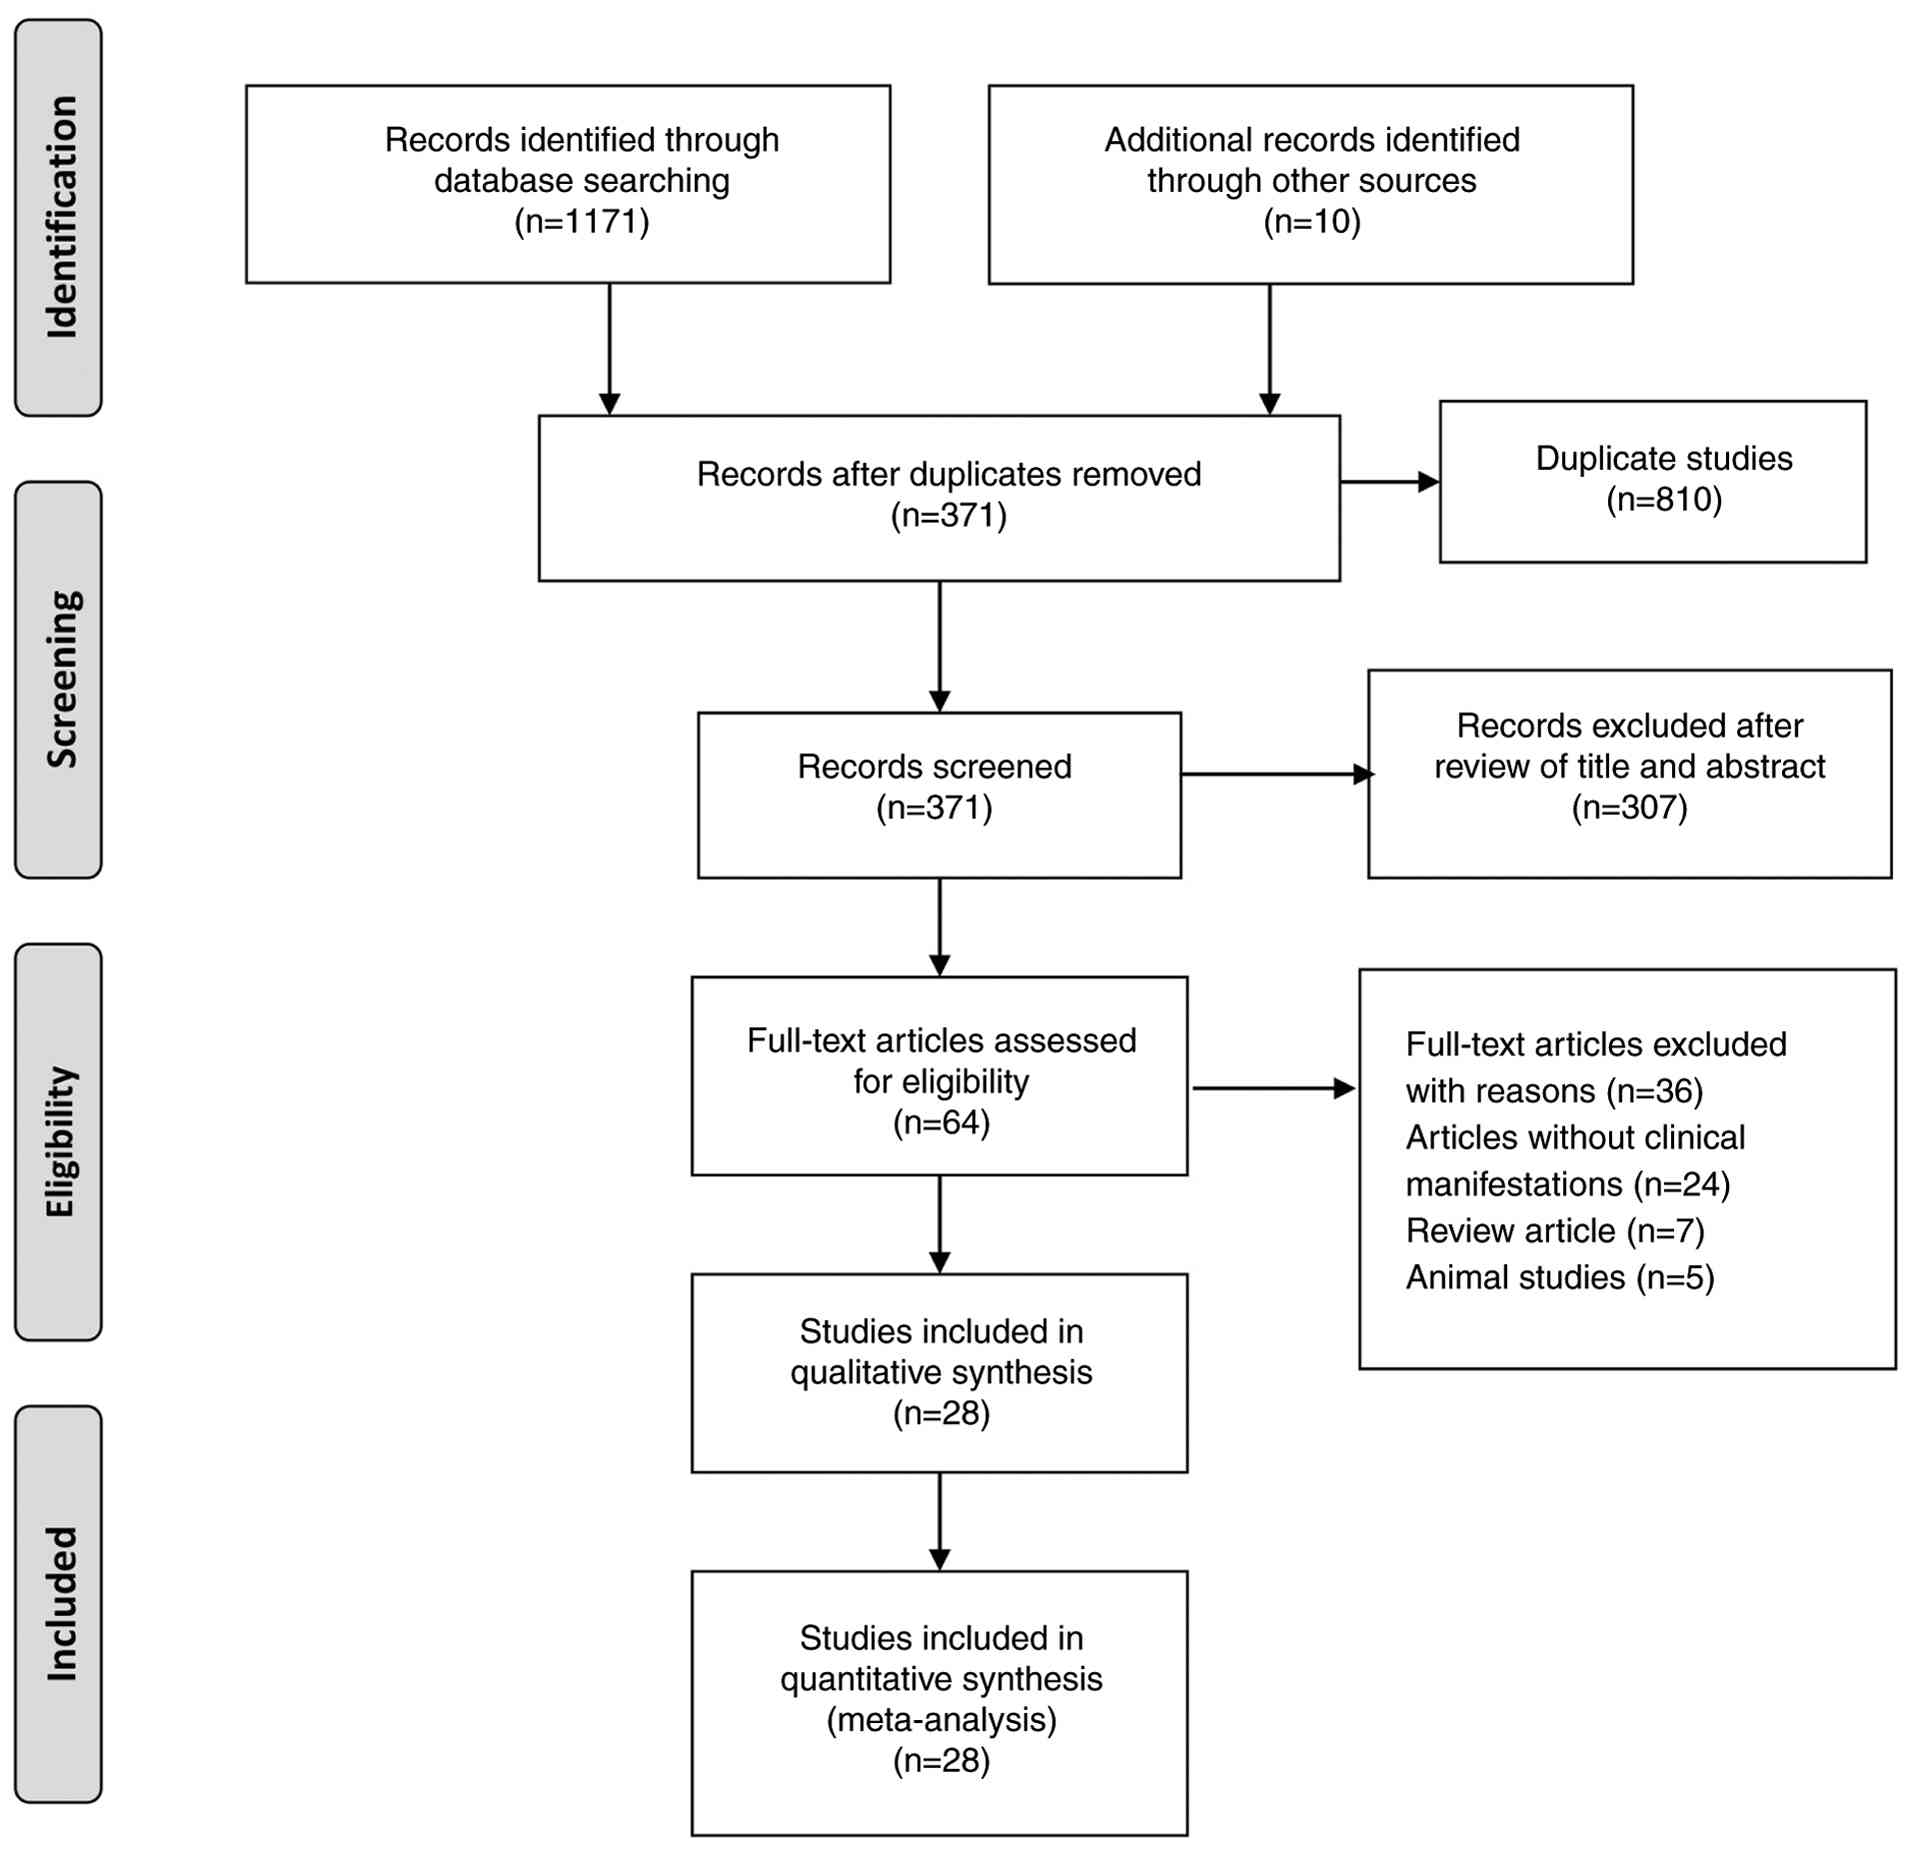
A total of 1,171 records were retrieved from the databases searched, with an additional 10 records identified from other sources. After removing duplicates, 371 records remained for eligibility assessment. After excluding studies that did not meet the predefined inclusion criteria, 28 articles were selected for inclusion in the present systematic review, encompassing a total sample size of 4,196 participants. The study selection process is illustrated in Fig. 1. Of these, 26 were observational studies, and two studies were case series. An overview of the 28 included articles revealed that 14 studies were conducted in Brazil (2,11-23), eight in Peru (24-31), two in France (32,33), two in Cuba (34,35), one in Colombia (36), and one study in the USA (37). The sample sizes of the included studies varied considerably, ranging from as few as 5 participants to as many as 2,272, highlighting the diverse scale and scope of the OROV research. The studies were conducted between 1976 and 2025. The detailed characteristics of the 28 included studies are presented in Table I.
Methodological quality of the included studies
The overall methodological quality of the majority of the studies, as assessed using the modified Newcastle-Ottawa Scale, was high, with a score of ≥5. A total of three studies were classified as moderate quality (with a score of 4). A summayr of the Newcastle-Ottawa Scale scores for each study, along with a brief overview of each item, is presented in Table SII. Furthermore, the methodological quality assessment of the case series was also of high quality (Table SIII).
Meta-analyses of prevalence: General or systemic manifestations
Fever
The pooled prevalence of fever among patients infected with OROV was 97.0% (95% CI, 93.5-99.4%) across 28 studies, encompassing a total of 4,196 participants (Fig. 2A). The heterogeneity across studies was substantial, with an I2 value of 93.1%, indicating significant variability in the reported prevalence rates between studies (Table II). A sensitivity analysis was performed by sequentially omitting one study at a time. The pooled prevalence of fever remained consistent, indicating that no individual study affected the overall result, demonstrating the robustness of the findings (Fig. S1A).
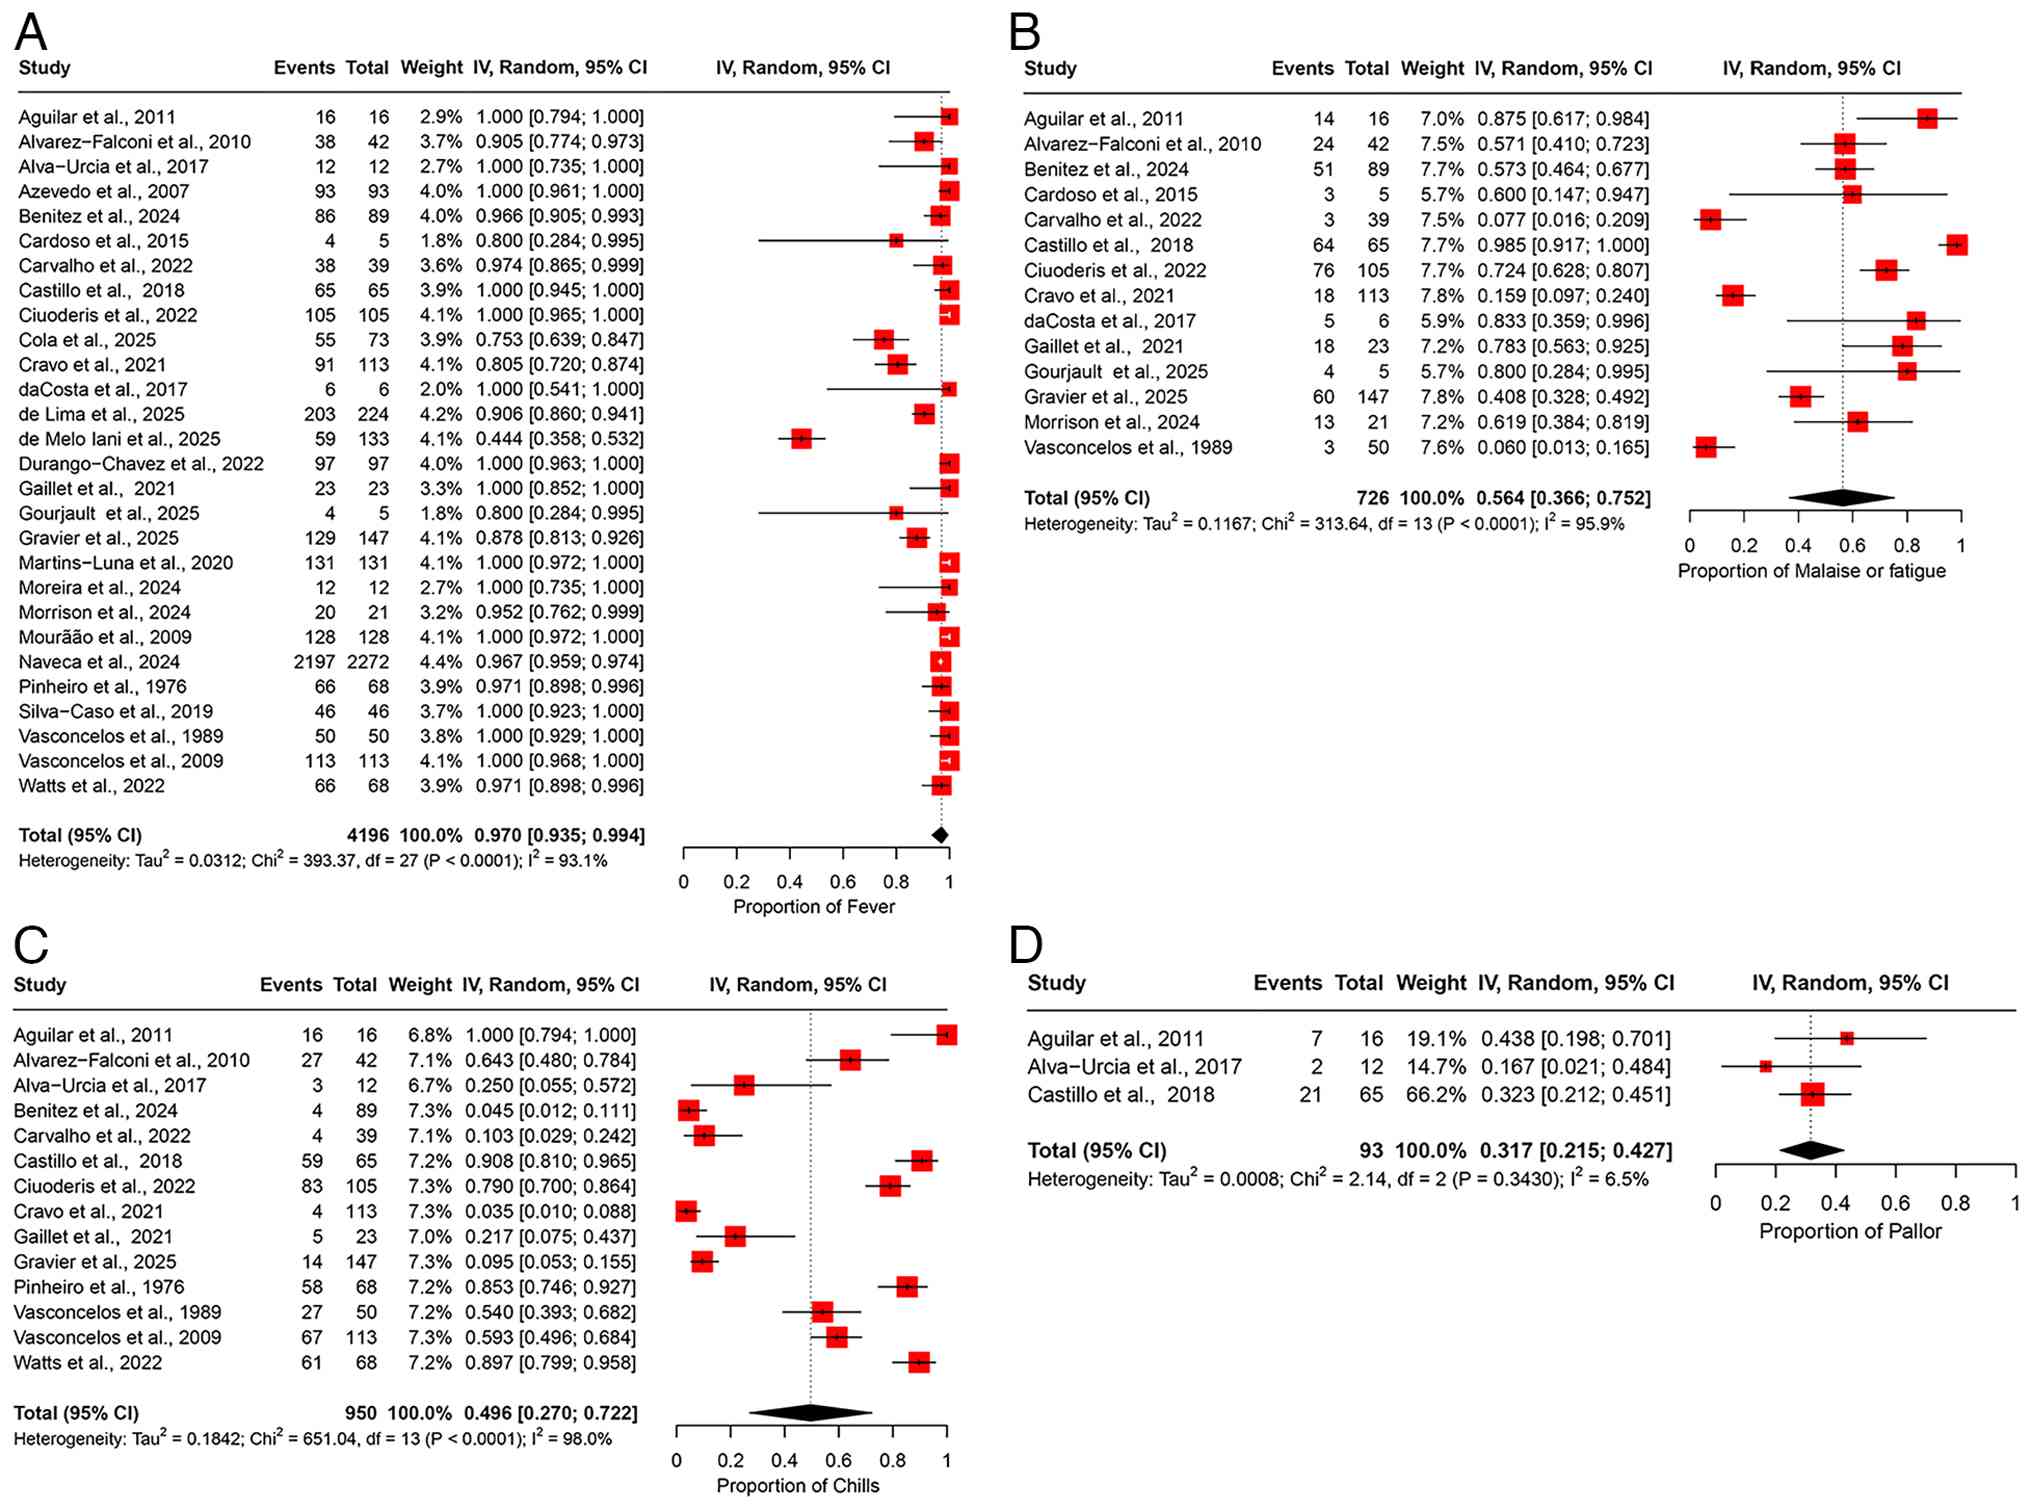
Malaise or fatigue. The pooled prevalence of malaise or fatigue across 14 studies involving 726 participants was 56.4% (95% CI, 36.6-75.2%) (Fig. 2B). An I2 value of 95.9% indicated substantial heterogeneity in the prevalence estimates reported across the studies (Table II). A sensitivity analysis was conducted by sequentially omitting one study at a time from the meta-analysis. The pooled prevalence estimates remained relatively stable, ranging from 53.7% (95% CI, 33.4-3.5%) to 61.3% (95% CI, 41.7-79.3%) (Fig. S1B). These results suggest that no single study significantly affected the overall pooled prevalence estimate, indicating the robustness of our findings.
Chills. The pooled prevalence of chills was 49.6% (95% CI, 27.0-72.2%) among patients with OROV infection, based on data from 950 patients across 14 studies (Fig. 2C). The heterogeneity in the prevalence of chills was high, with an I2 value of 98%, suggesting considerable differences in the rates of chills across studies (Table II). The results of the sensitivity analysis, in which one study was excluded at a time, demonstrated that the overall prevalence estimate of chills remained stable and was not significantly impacted by leaving one study at a time (Fig. S1C).
Pallor. Only three studies provided data on the prevalence of pallor, yielding a pooled prevalence of 31.7% (95% CI, 21.5-42.7%) with a total of 93 participants (Fig. 2D). The studies exhibited low heterogeneity, with an I2 value of 6.5%, suggesting consistency in the results (Table II). A sensitivity analysis, performed by sequentially removing one study at a time, demonstrated that the pooled prevalence estimate remained stable and was not significantly influenced by the exclusion of any individual study (Fig. S1D).
Meta-analyses of prevalence: Neurological manifestations. Headache
A meta-analysis of 28 studies, including 4,196 patients with OROV infection, estimated the polled prevalence of headaches at 86.5% (95% CI, 82.2-90.3%) (Fig. 3A). A substantial degree of heterogeneity was observed (I2=87.3%) (Table II). The leave-one-out sensitivity analysis further confirmed the robustness of these findings, indicating that omitting any single study did not significantly alter the pooled estimate (Fig. S2A).
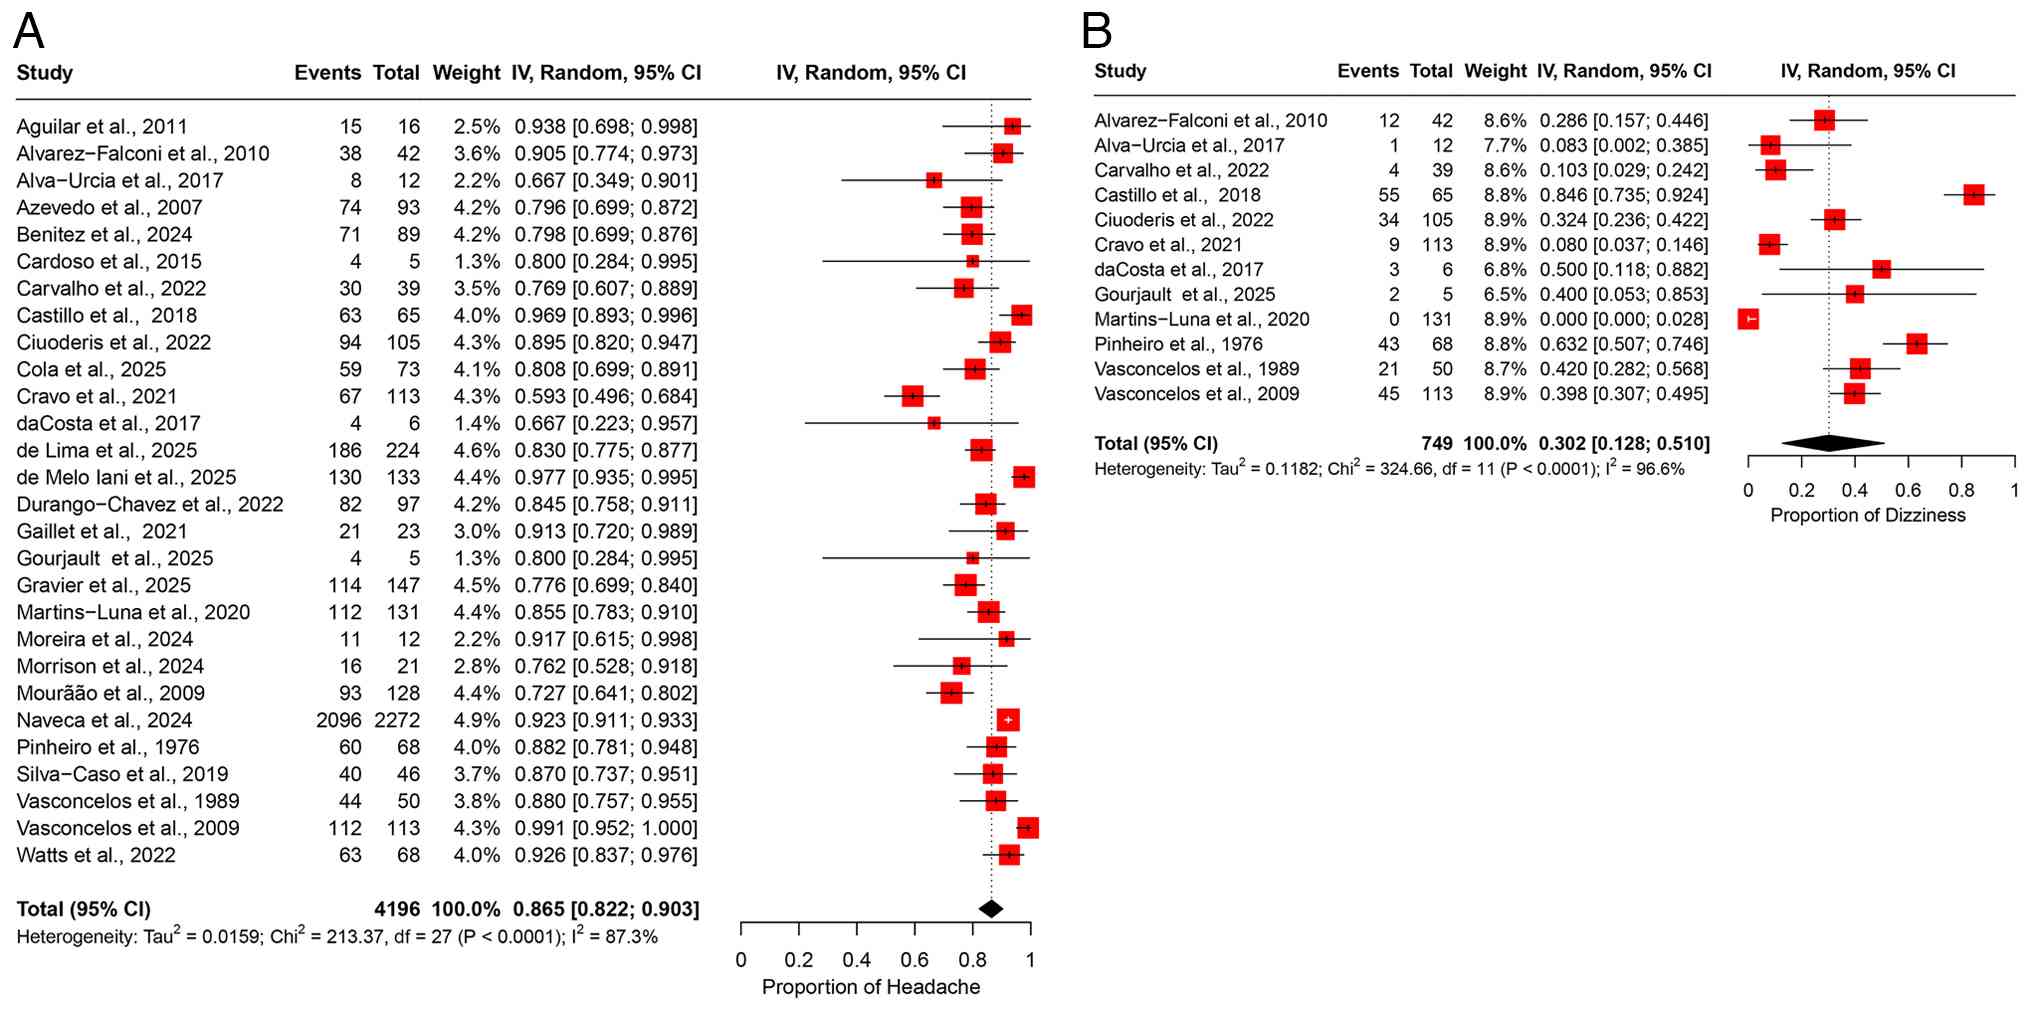
Dizziness. Dizziness was reported in 12 studies, encompassing 749 patients, with a pooled prevalence of 30.2% (95% CI, 12.8-51.0%) (Fig. 3B). A substantial degree of heterogeneity was observed across the studies, as indicated by an I2 value of 96.6% (Table II). A leave-one-out sensitivity analysis confirmed that excluding individual studies at a time did not alter the overall prevalence estimate, indicating the stability of the findings (Fig. S2B).
Meta-analyses of prevalence: Ocular manifestations
Eye pain
A total of 24 studies comprising 3,754 participants were included in the meta-analysis of eye pain, yielding a pooled prevalence estimate of 43.2% (95% CI, 35.5-50.9%) (Fig. 4A). There was substantial heterogeneity among studies (I2=91.7%), suggesting considerable variability in the reported prevalence of eye pain across different study populations (Table II). Sensitivity analysis using a leave-one-out approach demonstrated that the omission of any single study had no substantial impact on the overall pooled prevalence estimate (Fig. S3A).
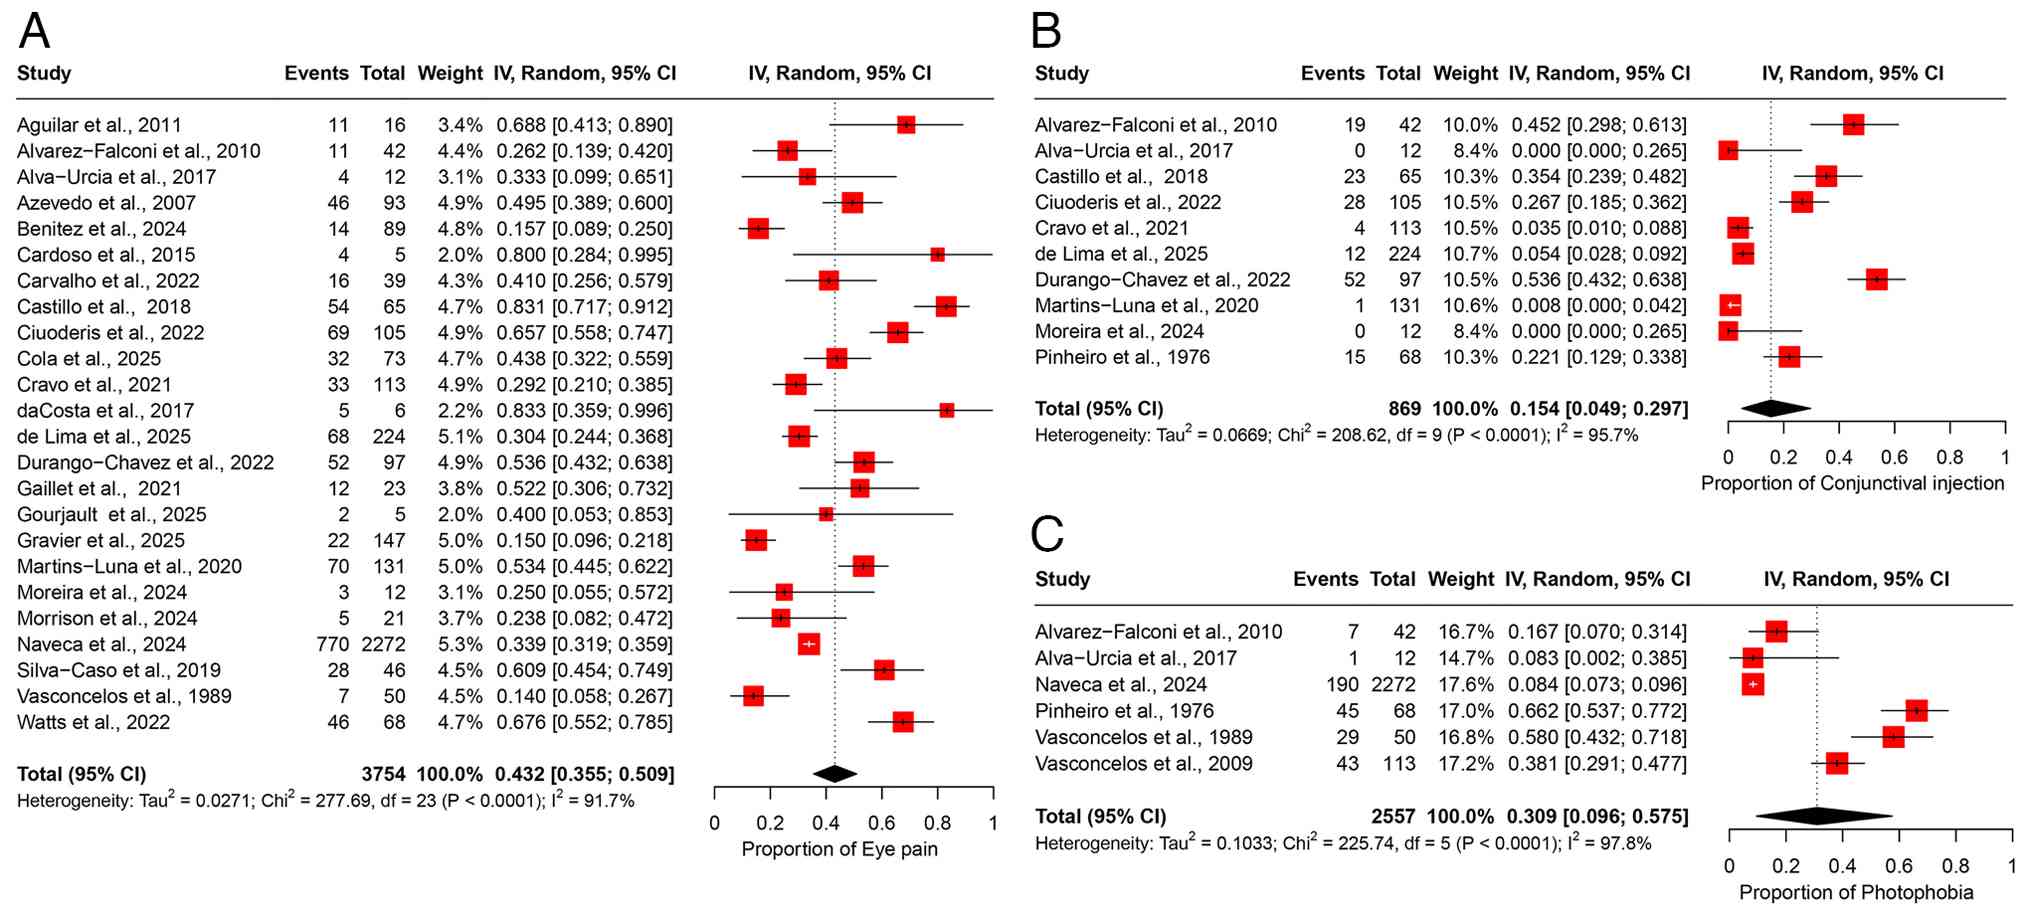
Conjunctival injection. A total of 10 studies involving 869 participants were included in the meta-analysis of conjunctival injection, yielding a pooled prevalence estimate of 15.4% (95% CI, 4.9-29.7%) (Fig. 4B). Considerable heterogeneity was observed among the included studies (I2=95.7%), reflecting substantial variability in reported prevalence across different populations (Table II). Sensitivity analysis using a leave-one-out approach indicated that removing any single study did not significantly influence the overall prevalence estimate (Fig. S3B).
Photophobia. Of note, six studies, with a total of 2,557 participants were included in the analysis of photophobia, yielding a pooled prevalence of 30.9% (95% CI, 9.6-57.5%) (Fig. 4C). Significant heterogeneity was observed across studies (I2=97.8%), indicating variability in prevalence estimates among different populations (Table II). Sensitivity analysis using a leave-one-out approach showed that excluding any single study did not notably affect the overall pooled estimate (Fig. S3C).
Meta-analyses of prevalence: Respiratory manifestations
Cough. A total of eight studies, comprising 491 participants, were included in the analysis of cough, resulting in a pooled prevalence of 12.9% (95% CI, 3.1-27.1%) (Fig. 5A). High heterogeneity was observed across the studies (I2=92.9%), indicating marked variability in the reported prevalence of cough among different study populations (Table II). Leave-one-out sensitivity analysis confirmed the stability of the pooled estimate, with the exclusion of any individual study having minimal impact on the overall result (Fig. S4A).
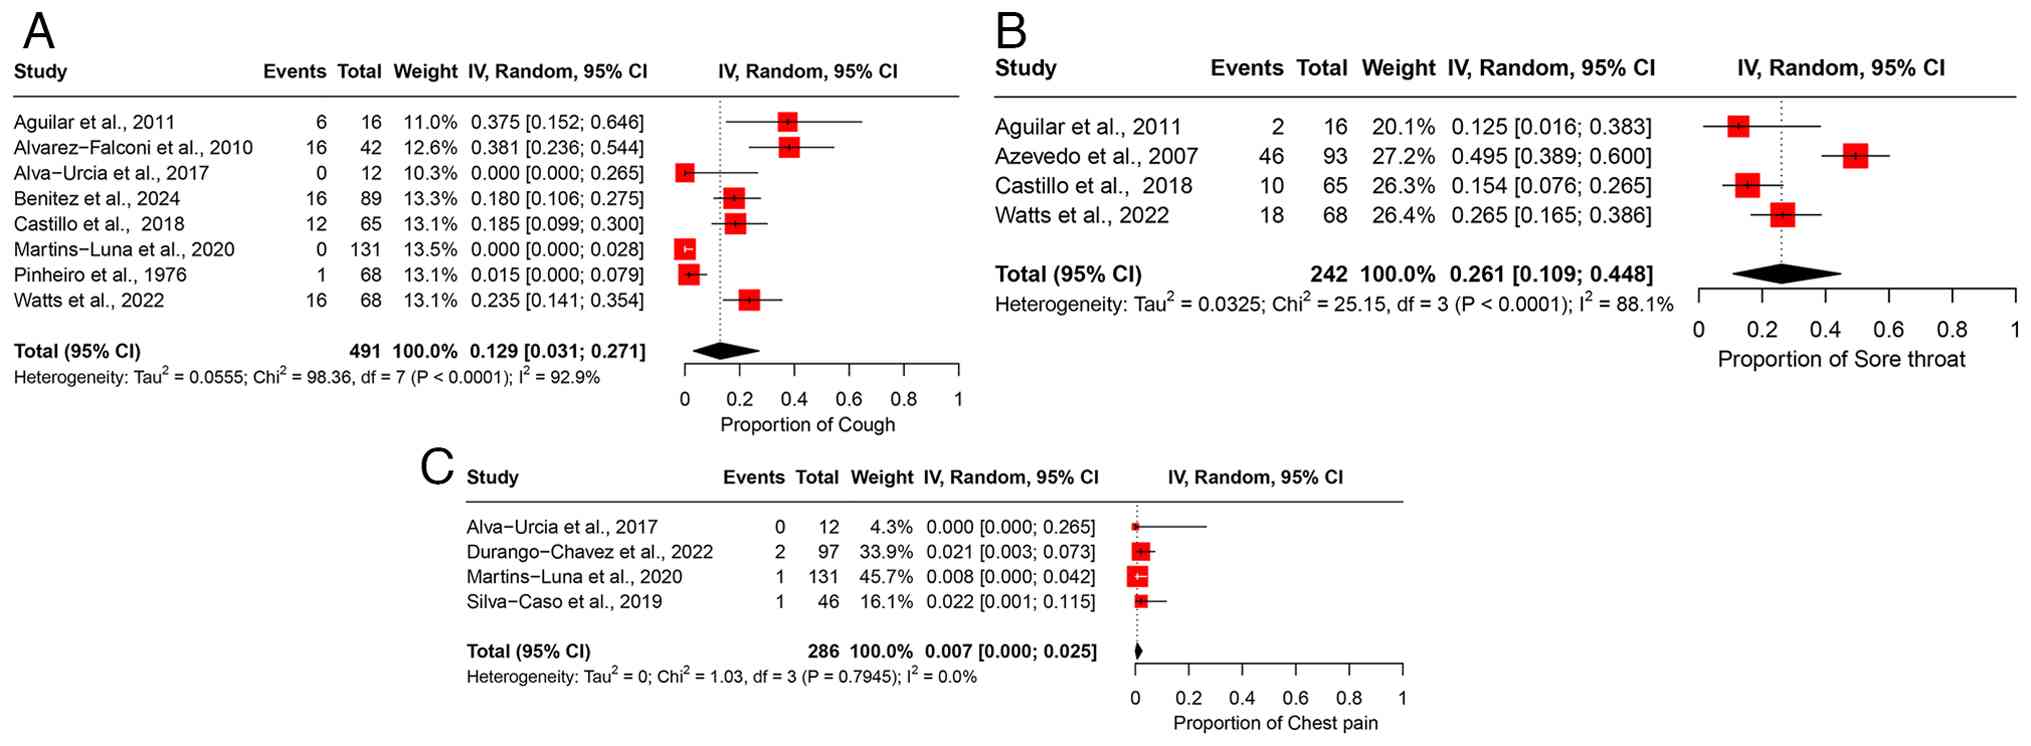
Sore throat. The analysis of sore throat included four studies with 242 participants, yielding a pooled prevalence of 26.1% (95% CI, 10.9-44.8%) (Fig. 5B). The studies exhibited high heterogeneity (I2=88.1%), suggesting substantial differences in the prevalence estimates across various study populations (Table II). Sensitivity analysis using the leave-one-out method indicated that removing any individual study did not notably affect the overall pooled estimate (Fig. S4B).
Chest pain. Four studies involving 286 participants were included in the analysis of chest pain, resulting in a pooled prevalence of 0.7% (95% CI, 0.0-2.5%) (Fig. 5C). No significant heterogeneity was observed across the studies (I2=0%), indicating a consistent prevalence estimate across the included populations (Table II). Leave-one-out sensitivity analysis confirmed that excluding any single study had no notable impact on the overall pooled estimate (Fig. S4C).
Meta-analyses of prevalence: Gastrointestinal manifestations. Nausea/vomiting
The pooled prevalence of nausea/vomiting was 28.9% (95% CI, 16.7-42.7%), based on data from 28 studies involving 4,196 patients (Fig. 6A). High heterogeneity was observed among the studies (I2=98.3%), indicating substantial variability in the prevalence estimates (Table II). Sensitivity analysis, performed by sequentially excluding each study, revealed that the overall prevalence estimate remained stable and was not significantly influenced by the exclusion of any individual study (Fig. S5A).
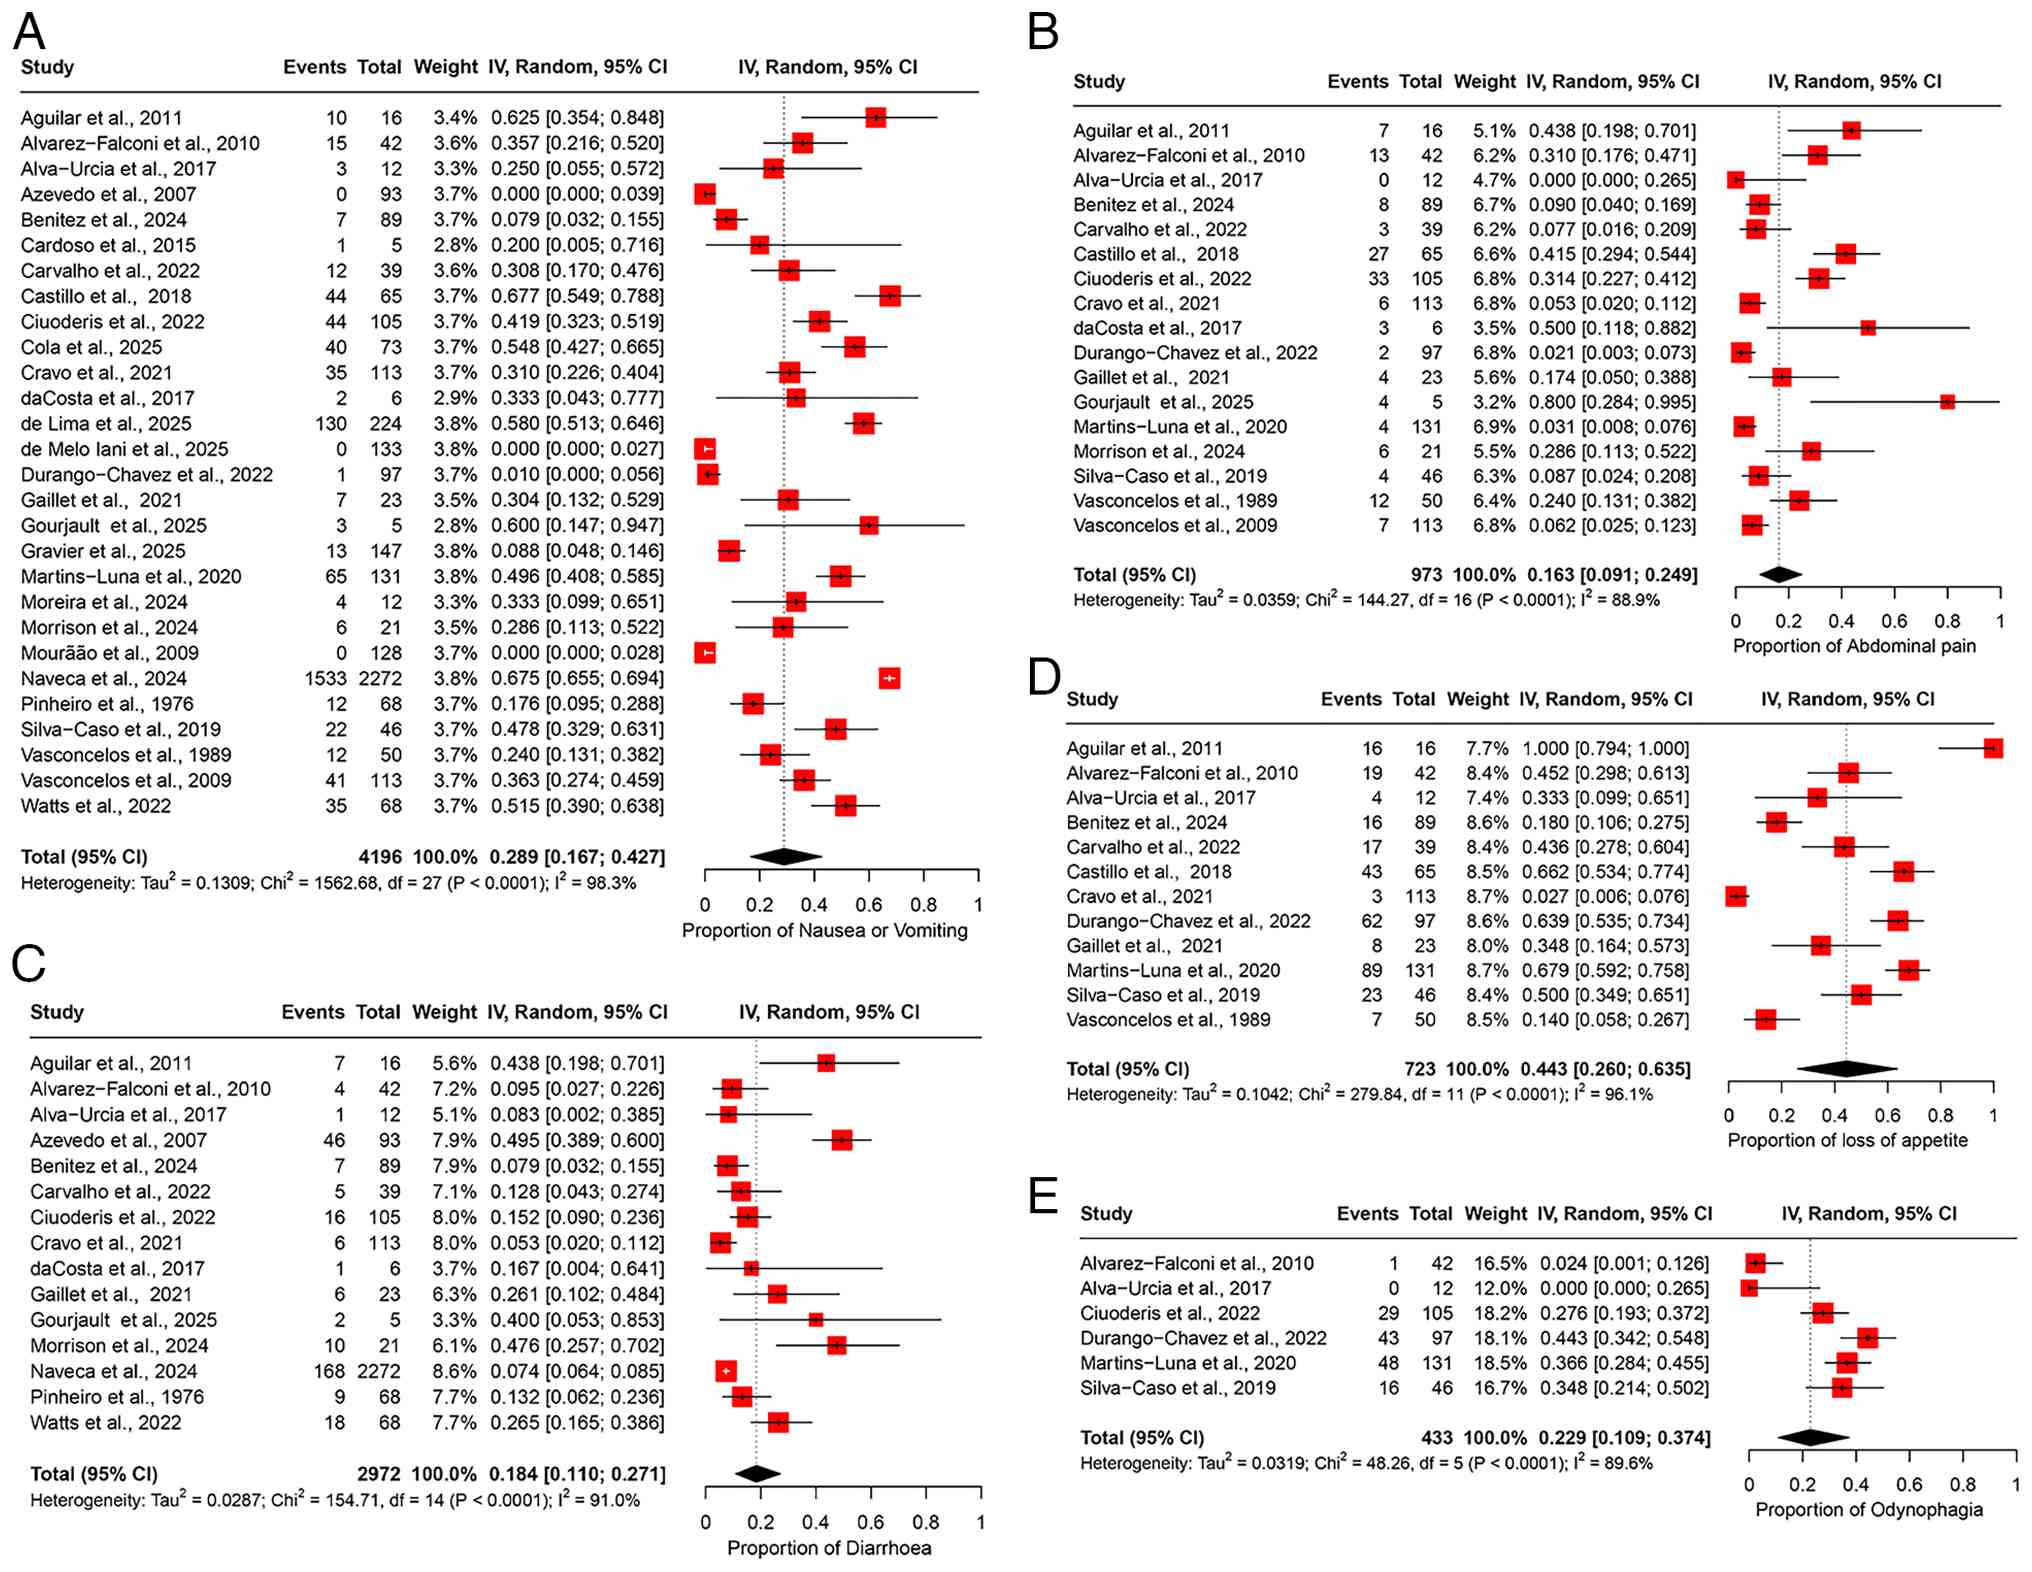
Abdominal pain. The pooled prevalence of abdominal pain was estimated at 16.3% (95% CI, 9.1-24.9%), based on data from 17 studies involving 973 participants (Fig. 6B). High heterogeneity was observed across the studies (I2=88.9%), indicating considerable variability in the prevalence estimates among different study populations (Table II). Sensitivity analysis, conducted by sequentially excluding each study at a time, confirmed that the overall prevalence estimate remained robust and was not significantly altered by excluding any individual study (Fig. S5B).
Diarrhea. The pooled prevalence of diarrhea was 18.4% (95% CI, 11.0-27.1%), based on data from 15 studies involving 2,972 participants (Fig. 6C), with high heterogeneity observed across the studies (I2=91.0%), suggesting considerable variability in the prevalence estimates among different study populations (Table II). A sensitivity analysis, excluding one study at a time, demonstrated that the overall prevalence estimate remained stable, influenced by the exclusion of any individual study (Fig. S5C).
Loss of appetite. The pooled prevalence of loss of appetite was 44.3% (95% CI, 26.0-63.5%), based on data from 12 studies involving 723 participants (Fig. 6D). High heterogeneity was observed among the studies (I2=96.1%), indicating substantial variability in the prevalence estimates across different study populations (Table II). Sensitivity analysis, performed by sequentially excluding one study at a time, revealed that the overall prevalence estimate remained stable and was not significantly affected by excluding any individual study (Fig. S5D).
Odynophagia. The pooled prevalence of odynophagia was 22.9% (95% CI, 10.9-37.4%), based on data from 6 studies involving 433 participants (Fig. 6E). The studies exhibited high heterogeneity (I2=89.6%), suggesting considerable variation in the prevalence estimates across the different study cohorts (Table II). Sensitivity analysis, conducted by excluding one study at a time, indicated that the overall prevalence estimate remained robust and was not substantially affected by the removal of any particular study (Fig. S5E).
Meta-analyses of prevalence: Musculoskeletal manifestations. Myalgia
The pooled prevalence of myalgia was 72.3% (95% CI, 65.1-79.0%), based on data from 25 studies involving 3,974 participants (Fig. 7A). A substantial degree of heterogeneity was observed across the studies (I2=92.5%), suggesting notable variability in the prevalence estimates among the different study populations (Table II). Sensitivity analysis, conducted through a leave-one-out meta-analysis by sequentially excluding each study, demonstrated that the overall prevalence estimate remained consistent and was not significantly impacted by excluding any individual study (Fig. S6A).
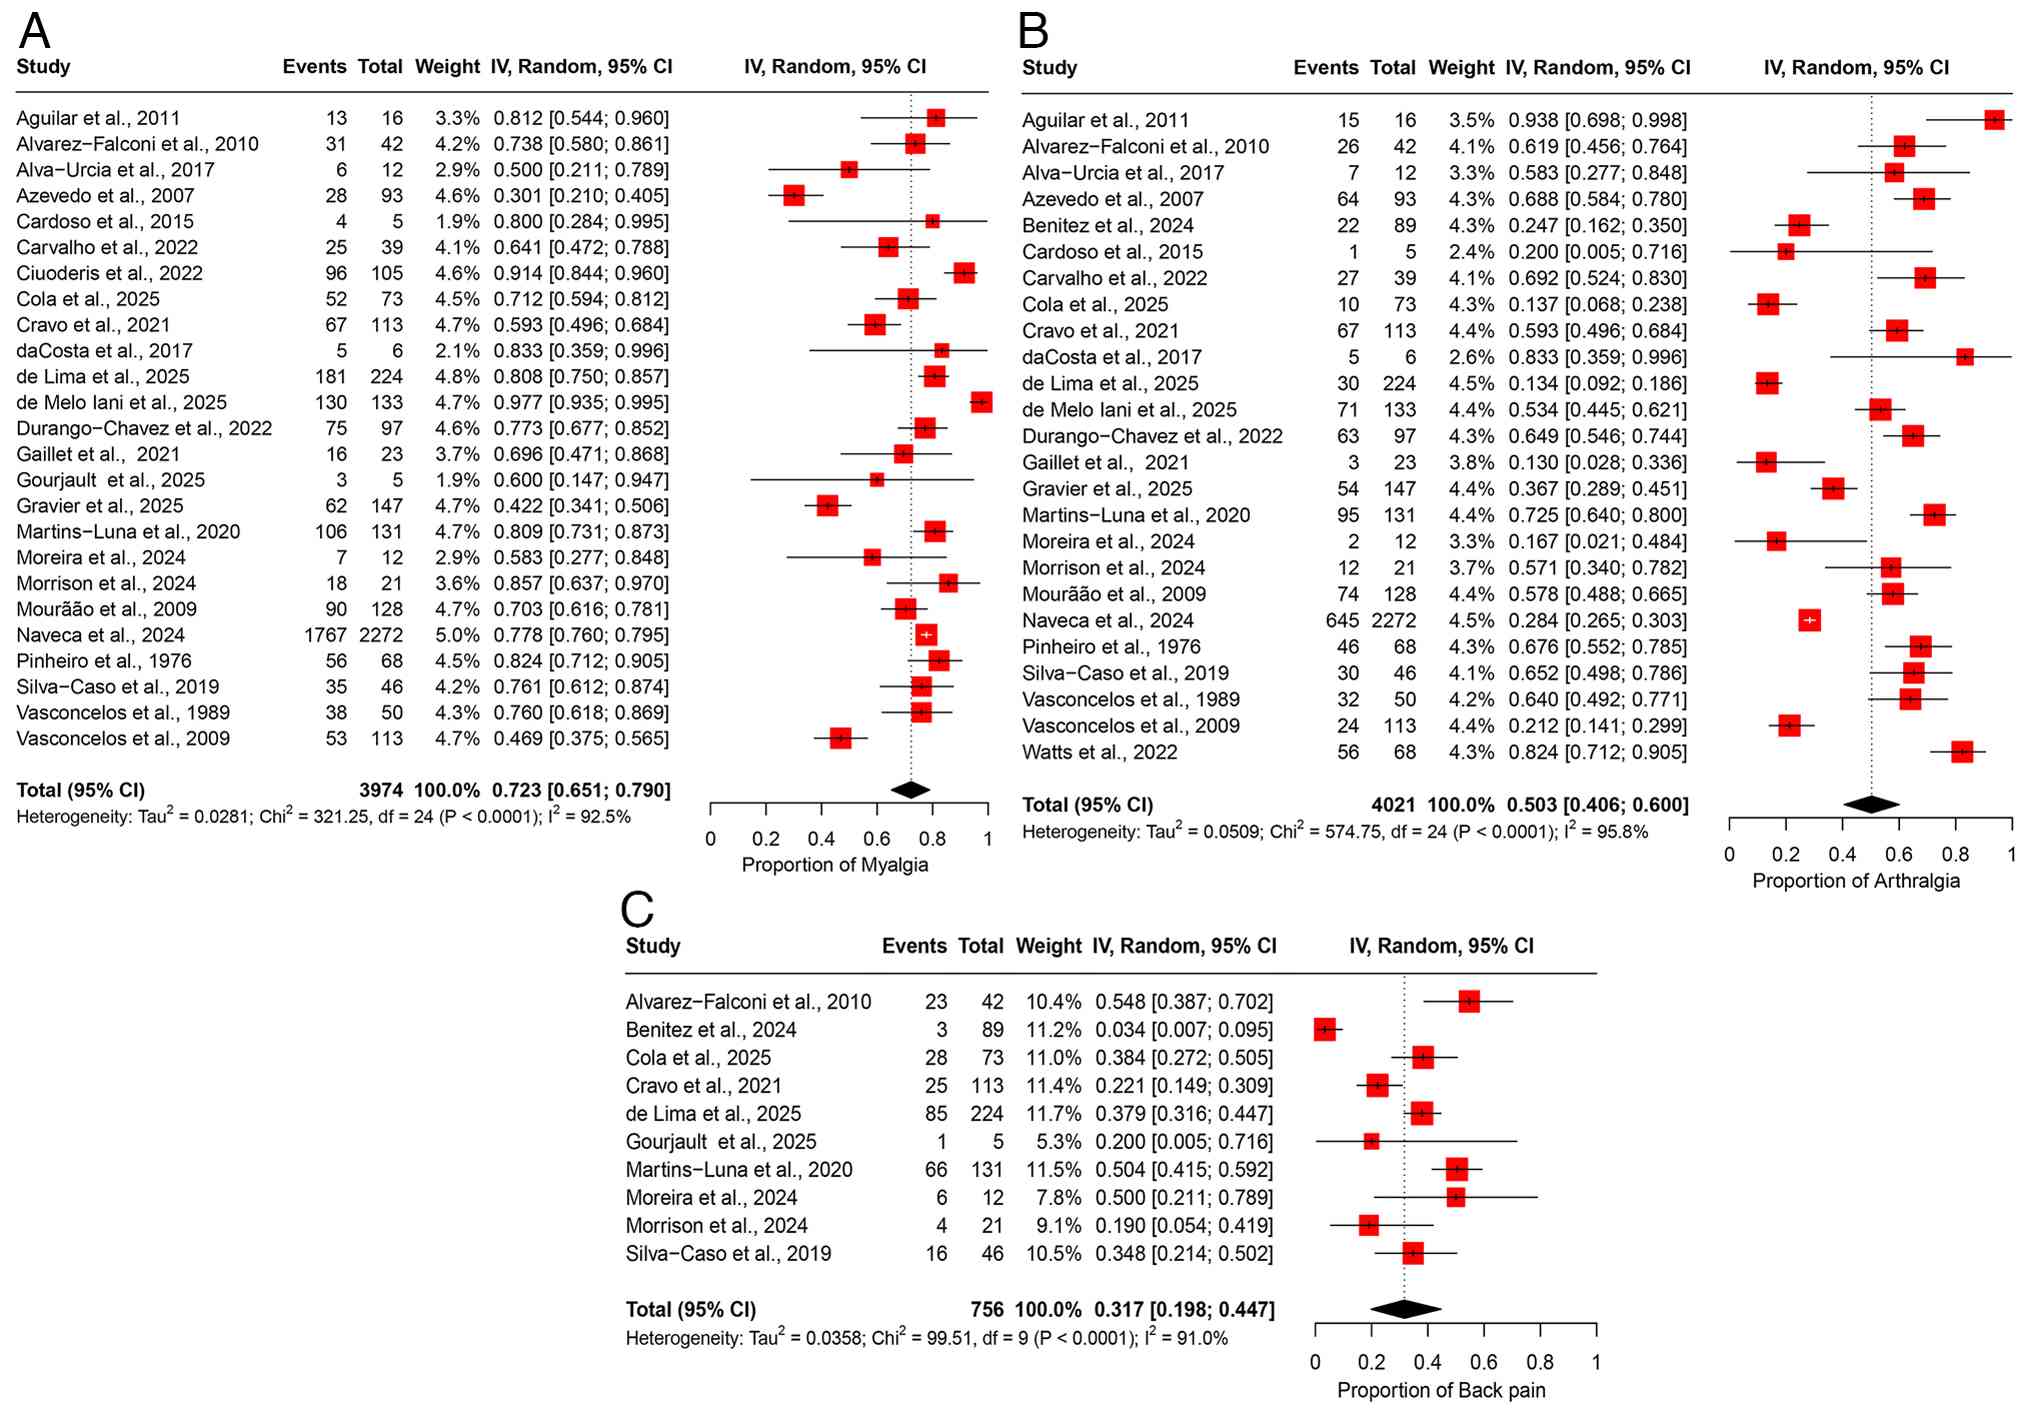
Arthralgia. The pooled prevalence of arthralgia was 50.3% (95% CI, 40.6-60.0%), based on data from 25 studies involving 4,021 participants (Fig. 7B). Significant heterogeneity was observed across the studies (I2=95.8%), suggesting notable variability in the prevalence estimates across different study populations (Table II). Sensitivity analysis, conducted via a leave-one-out meta-analysis by excluding each study, revealed that the overall prevalence estimate remained stable and was not notably impacted by the exclusion of any individual study (Fig. S6B).
Back pain. The pooled prevalence of back pain was 31.7% (95% CI, 19.8-44.7%), based on data from 10 studies involving 756 participants (Fig. 7C). Moderate heterogeneity was observed among the studies (I2=91.0%), indicating substantial variability in the prevalence estimates across the study populations (Table II). Sensitivity analysis, conducted by sequentially excluding each study, demonstrated that the overall prevalence estimate remained stable and was not significantly influenced by the exclusion of any individual study (Fig. S6C).
Meta-analyses of prevalence: Dermatological manifestations. Skin rash
The pooled prevalence of skin rash was 18.2% (95% CI, 9.9-28.1%), based on data from 17 studies involving 3,379 participants (Fig. 8A). High heterogeneity was observed across the studies (I2=95.7%), indicating substantial variability in the prevalence estimates among the study populations (Table II). Sensitivity analysis, performed by sequentially excluding each study, revealed that the overall prevalence estimate remained stable and was not significantly influenced by the exclusion of any individual study (Fig. S7A).
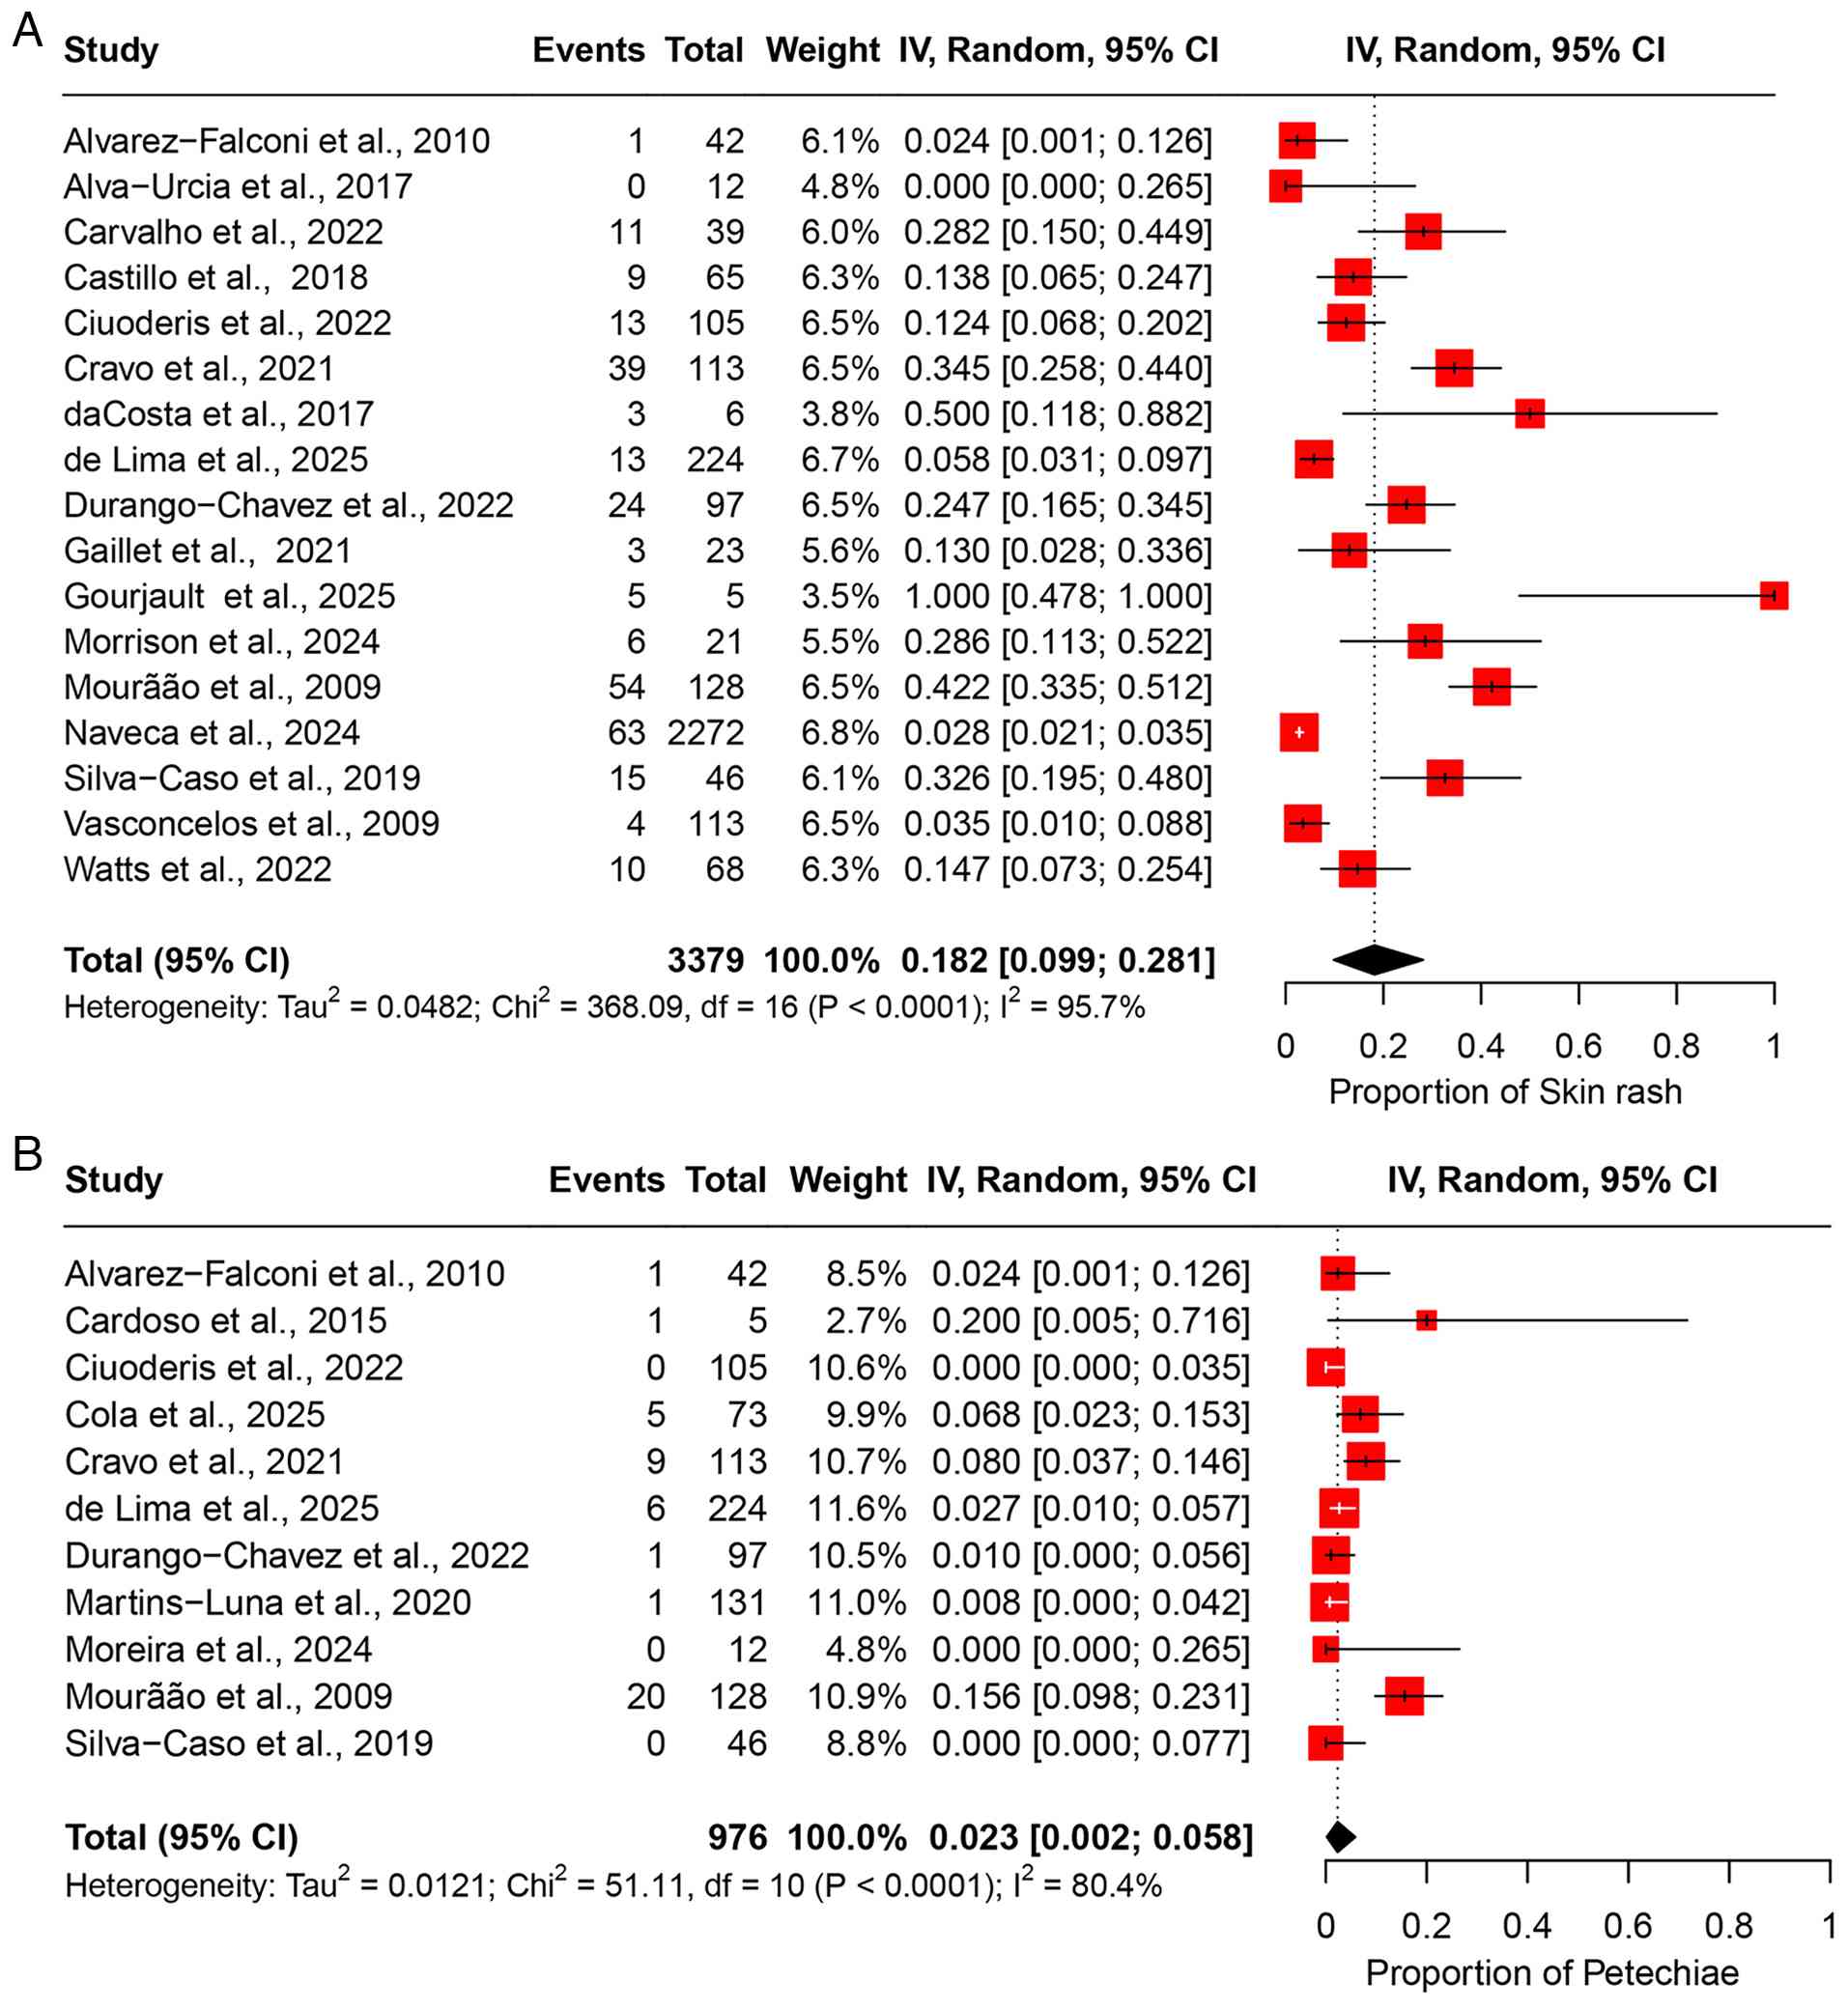
Petechiae. Based on 11 studies comprising 976 participants, the pooled prevalence of petechiae was estimated at 2.3% (95% CI, 0.2-5.8%) (Fig. 8B). The analysis revealed moderate heterogeneity (I2=80.4%), indicating certain inconsistency in prevalence rates across the included studies (Table II). A leave-one-out sensitivity analysis showed that the pooled estimate remained consistent, with no single study exerting a disproportionate influence on the overall result (Fig. S7B).
Publication bias
Funnel plots were generated for each of the clinical symptoms assessed to evaluate the presence of publication bias. All plots appeared symmetrical upon visual inspection, suggesting no apparent publication bias across the included studies. A representative funnel plot for fever is presented in Fig. S8 to avoid redundancy. Furthermore, Begg's rank correlation tests were conducted for each outcome and yielded non-significant results (P>0.05), providing additional evidence against the presence of publication bias.
Discussion
Findings of the present study. To the best of our knowledge, the present study is the largest and most comprehensive to date in examining all clinical presentations resulting from OROV infection through a systematic review and meta-analysis of cases reported from six countries across the globe. Common clinical manifestations with a prevalence >60% included fever (97%), headache (86.5%) and myalgia (72.3%). Manifestations with a prevalence between 20 and 60% were defined as intermediate presentations, including malaise or fatigue (56.4%), arthralgia (50.3%), chills (49.6%), loss of appetite (44.3%), eye pain (43.2%), back pain (31.7%), pallor (31.7%), dizziness (30.2%), photophobia (30.9%), nausea/vomiting (28.9%), sore throat (26.1%) and odynophagia (22.9%). Manifestations with a prevalence <20% were defined as rare presentations, including diarrhea (18.4%), skin rash (18.2%), conjunctival injection (15.4%), abdominal pain (16.3%), petechiae (2.3%), cough (12.9%) and chest pain (0.7%). The findings of the present study provide a valuable reference for frontline clinicians in OROV-endemic regions, emphasizing that the presence of fever, headache and myalgia, primarily when occurring together, should raise clinical suspicion for OROV infection. The early recognition of intermediate and rare manifestations can further support timely diagnosis, inform differential diagnoses, and improve case management and patient outcomes during outbreaks.
Comparison with previous studies. Studies on OROV infection outcomes with large sample sizes are limited, with the most extensive study to date being conducted by Naveca et al in Brazil (12), which included 2,272 patients. The majority of existing literature consists of case reports or small cohort studies, leaving the clinical presentation of OROV unclear. To address this issue, the present systematic review and meta-analysis was conducted in an aim to provide a better understanding of the symptom profile of OROV based on previously published studies. Despite being recognized as an emerging public health threat in Latin America, OROV remains understudied compared to other arboviruses, such as dengue or Zika. Notably, while only a small number of systematic reviews and meta-analyses on OROV have been published (1,38,39), the majority focus on narrow aspects of the virus, such as its epidemiology or specific outbreaks, and often include smaller cohorts than the present study. The limited scope of these studies has left critical gaps in the understanding of the full clinical spectrum, transmission dynamics and global burden of OROV. The present meta-analysis included studies from six countries, with the majority of data derived from Brazil (2,11-23) and Peru (24-31), both highly endemic regions for OROV. Across these regions, fever, headache and myalgia consistently emerged as the most prevalent symptoms. However, certain manifestations, such as rash, odynophagia and gastrointestinal symptoms, exhibited variations in prevalence between countries. For instance, rash was reported more frequently in Brazilian cohorts (17) compared to those from Peru (27), potentially reflecting differences in viral genotypes, vector ecology, or case ascertainment practices. Similarly, gastrointestinal symptoms, such as nausea and diarrhea were more commonly observed in Peruvian studies (24-31). These regional differences underscore the importance of considering geographic context when diagnosing and managing OROV infection. Variability in healthcare access, surveillance systems and diagnostic criteria may also influence reported symptom profiles. Understanding these variations is critical for tailoring public health responses and clinical management strategies in distinct endemic areas.
The findings presented herein align with the previous meta-analysis performed by Wang et al (38), which pooled data from 15 studies involving 806 OROV-infected patients. Their analysis identified fever, headache, myalgia and arthralgia as the most common clinical manifestations of OROV infection. However, that meta-analysis did not include the most extensive study on OROV infection, conducted by Naveca et al (12), which analyzed data from 2,272 patients, limiting its generalizability. By contrast, the present study integrated data from 28 studies involving 4,196 participants, which is >5-fold greater than the sample size of the previous meta-analysis (38), providing a broader and more representative symptom profile. This expanded analysis allows for greater precision in estimating symptom prevalence and enhances the understanding of the clinical presentation of OROV, which is critical for timely diagnosis, appropriate case management and targeted public health interventions in endemic regions.
Moreover, the findings of the present study are consistent with those in the study by Tortosa et al (39), particularly in the high prevalence of fever and headache in OROV, which were consistently reported in both studies. Both analyses also demonstrate a notable association with musculoskeletal symptoms, such as myalgia and arthralgia. However, the present meta-analysis broadens the scope of the study by Tortosa et al (39) by including additional symptoms, such as chills, malaise and back pain, which were less frequently observed in their research. Additionally, while both studies report gastrointestinal symptoms such as nausea and diarrhea, the results presented herein demonstrate a higher prevalence, potentially indicating regional variations. These results reinforce the need for comprehensive symptom surveillance to ensure accurate diagnosis and effective monitoring. The systematic review by Pereira et al (40) examined the epidemiological distribution and exposure rates of OROV in South America, whereas the present meta-analysis emphasized the clinical manifestations of OROV infection, providing a more in-depth understanding of its clinical features and aiding in the development of better diagnostic and public health approaches in areas where the virus is endemic. The systematic review and meta-analysis performed by Kharwadkar and Herath (41) examined the clinical manifestations of dengue, Zika and chikungunya in the Pacific Islands, revealing distinct symptom profiles among these arboviruses. Their study found that dengue was most frequently associated with fever and headache, whereas a higher prevalence of rash, conjunctivitis and peripheral edema characterized Zika infections (41). Chikungunya, by contrast, was predominantly associated with fever and arthralgia. Additionally, the study by Kharwadkar and Herath (41) highlighted the occurrence of Guillain-Barré syndrome (GBS) in both Zika and chikungunya, with dengue having a hospitalization rate of 9.90% and a mortality rate of 0.23%. When comparing these findings to our study on OROV, significant differences emerge. OROV demonstrates a higher prevalence of ocular manifestations, such as conjunctival injection and photophobia, which were not as prominent in the other arboviruses discussed Kharwadkar and Herath (41). Furthermore, neurological symptoms, including dizziness, were more commonly observed in OROV infections, distinguishing it from the less frequent neurological manifestations in dengue, Zika and chikungunya. The unique symptom profile, particularly the ocular and neurological features, highlights the distinct clinical presentation of OROV compared to the more commonly shared manifestations of fever, headache and rash in other arboviral infections.
The present systematic review and meta-analysis aimed to address the limitations of previous studies by providing a more comprehensive and methodologically rigorous synthesis of the clinical manifestations associated with OROV infection. The substantial heterogeneity observed across many clinical manifestations (I2>75%) suggests significant variability in symptom reporting across the included studies. This variability may stem from differences in diagnostic criteria, healthcare access, viral strain diversity, surveillance intensity and population characteristics. From a clinical standpoint, this poses challenges for accurate diagnosis and public health monitoring, particularly in regions where OROV co-circulates with other arboviruses such as dengue or Zika. Inconsistent symptom definitions across studies may also contribute to reporting bias, particularly for less common or subjective symptoms. These findings underscore the urgent need for internationally standardized clinical definitions and classification criteria for OROV infection, particularly for identifying severe or complicated cases. The elevated prevalence of clinical symptoms identified in the present analysis may, in part, be attributed to the inclusion of 14 studies from Brazil and eight from Peru, countries with high endemicity of OROV. Although the present study incorporated data from six countries, the predominance of studies originating from Brazil and Peru may constrain the generalizability of the findings to other geographic regions. These two countries not only report higher levels of OROV endemicity, but also benefit from relatively advanced surveillance infrastructure, potentially influencing the detection and characterization of clinical manifestations. Variations in circulating OROV genotypes, diagnostic capacity and co-infection rates in other parts of Latin America, particuarlly in regions beyond the continent, may yield different clinical presentations. Accordingly, caution is warranted when extrapolating these results to underrepresented or non-endemic areas. Additional research encompassing a more diverse geographic locations is essential to validate and extend these findings.
The present study has several notable strengths. First, the present meta-analysis evaluated the system-wise clinical manifestations of OROV infection. Understanding these manifestations can help identify the most affected systems, allowing healthcare professionals to prioritize diagnostic and therapeutic strategies that may enhance patient management and deepen our understanding of OROV pathophysiology. Second, a sensitivity analyses was conducted for all clinical manifestations of OROV infection, which were not addressed in previous meta-analyses. This approach enhances the robustness and validity of the findings. Finally, a key strength of the present study is its global scope and large-scale meta-analysis, which includes data from six countries. Unlike previous analyses, which mainly relied on case reports and studies with small sample sizes, our study incorporated 28 studies with over 4,100 cases of OROV infection, offering a more comprehensive and robust evaluation.
However, the present study has several limitations, which should be mentioned. First, the majority of studies included in the present meta-analysis were retrospective cohort studies or case series, with limited data from prospective designs, which may introduce inherent selection and reporting biases and potentially affect the robustness of the findings. Second, since the majority of studies included in the present meta-analysis were conducted in South America, the applicability of the results to global populations may be constrained. Thirdly, significant heterogeneity was noted in the pooled analysis of several clinical manifestations of OROV infection. The differences in findings across various study locations imply that variations in reporting standards across countries may have played a significant role in the observed heterogeneity. Finally, the authors were unable to construct a phylogenetic tree of OROV strains, as genomic sequence data were not consistently reported in the included studies. This limits the ability to explore the genetic diversity and evolutionary dynamics of OROV
In conclusion, to the best of our knowledge, the present systematic review and meta-analysis is the first and most comprehensive study examining the full spectrum of clinical manifestations of OROV infection, analyzing cases from six countries. The most commonly reported manifestations of OROV were fever, headache, malaise or fatigue, chills, eye pain, etc. This study contributes significantly to understanding the current OROV outbreak, providing valuable insight for future research into the pathological mechanisms and epidemiology of the disease. Through a meta-analysis of clinical manifestations of OROV infection, the present study provides a comprehensive understanding of its symptoms, aiding in early diagnosis and improving diagnostic accuracy. It highlights symptom variability across populations, informs public health strategies, and guides future research into the pathophysiology and epidemiology of OROV. However, future research is required to prioritize longitudinal studies to investigate symptom progression, explore additional OROV manifestations, and extend geographic analysis to improve the generalizability of the findings.
Supplementary Material
Sensitivity analysis of included studies for general or systemic manifestations. (A) Sensitivity analysis of included studies for fever. (B) Sensitivity Analysis of Included studies for malaise or fatigue. (C) Sensitivity analysis of Included studies for chills. (D) Sensitivity analysis of included studies for pallor. The studies included were as follows: Aguilar et al (24), Alvarez-Falconi et al (25), Alva-Urcia et al (26), Azevedo et al (11), Benitez et al (34), Cardoso et al (16), Carvalho et al (17), Castillo et al (27), Ciuoderis et al (36), Cola et al (18), Cravo et al (19), da Costa et al (20), de Lima et al (21), de Melo Iani et al (22), Durango-Chavez et al (28), Gaillet et al (32), Gourjault et al (33), Gravier et al (35), Martins-Luna et al (29), Moreira et al (2), Morrison et al (37), Mourão et al (23), Naveca et al (12), Pinheiro et al (13), Silva-Caso et al (30), Vasconcelos et al (14), Vasconcelos et al (15), Watts et al (31) 95% CI, 95% confidence interval.
Sensitivity analysis of included studies for neurological manifestations. (A) Sensitivity analysis of included studies for headache. (B) Sensitivity analysis of included studies for dizziness. The studies included were as follows: Aguilar et al (24), Alvarez-Falconi et al (25), Alva-Urcia et al (26), Azevedo et al (11), Benitez et al (34), Cardoso et al (16), Carvalho et al (17), Castillo et al (27), Ciuoderis et al (36), Cola et al (18), Cravo et al (19), da Costa et al (20), de Lima et al (21), de Melo Iani et al (22), Durango-Chavez et al (28), Gaillet et al (32), Gourjault et al (33), Gravier et al (35), Martins-Luna et al (29), Moreira et al (2), Morrison et al (37), Mourão et al (23), Naveca et al (12), Pinheiro et al (13), Silva-Caso et al (30), Vasconcelos et al (14), Vasconcelos et al (15), Watts et al (31) 95% CI, 95% confidence interval.
Sensitivity analysis of included studies for ocular manifestations. (A) Sensitivity analysis of included studies for eye pain. (B) Sensitivity analysis of included studies for conjunctival injection. (C) Sensitivity analysis of included studies for photophobia. The studies included were as follows: Aguilar et al (24), Alvarez-Falconi et al (25), Alva-Urcia et al (26), Azevedo et al (11), Benitez et al (34), Cardoso et al (16), Carvalho et al (17), Castillo et al (27), Ciuoderis et al (36), Cola et al (18), Cravo et al (19), da Costa et al (20), de Lima et al (21), de Melo Iani et al (22), Durango-Chavez et al (28), Gaillet et al (32), Gourjault et al (33), Gravier et al (35), Martins-Luna et al (29), Moreira et al (2), Morrison et al (37), Mourão et al (23), Naveca et al (12), Pinheiro et al (13), Silva-Caso et al (30), Vasconcelos et al (14), Vasconcelos et al (15), Watts et al (31) 95% CI, 95% confidence interval.
Sensitivity analysis of included studies for respiratory manifestations. (A) Sensitivity analysis of included studies for cough. (B) Sensitivity analysis of included studies for sore throat. (C) Sensitivity analysis of included studies for chest pain. The studies included were as follows: Aguilar et al (24), Alvarez-Falconi et al (25), Alva-Urcia et al (26), Azevedo et al (11), Benitez et al (34), Cardoso et al (16), Carvalho et al (17), Castillo et al (27), Durango-Chavez et al (28), Martins-Luna et al (29), Pinheiro et al (13), Silva-Caso et al (30), Watts et al (31) 95% CI, 95% confidence interval.
Sensitivity analysis of included studies for gastrointestinal manifestations. (A) Sensitivity analysis of Included studies for nausea or vomiting. (B) Sensitivity analysis of included studies for abdominal pain. (C) Sensitivity analysis of included studies for diarrhoea. (D) Sensitivity analysis of included studies for loss of appetite. (E) sensitivity analysis of included studies for odynophagia. The studies included were as follows: Aguilar et al (24), Alvarez-Falconi et al (25), Alva-Urcia et al (26), Azevedo et al (11), Benitez et al (34), Cardoso et al (16), Carvalho et al (17), Castillo et al (27), Ciuoderis et al (36), Cola et al (18), Cravo et al (19), da Costa et al (20), de Lima et al (21), de Melo Iani et al (22), Durango-Chavez et al (28), Gaillet et al (32), Gourjault et al (33), Gravier et al (35), Martins-Luna et al (29), Moreira et al (2), Morrison et al (37), Mourão et al (23), Naveca et al (12), Pinheiro et al (13), Silva-Caso et al (30), Vasconcelos et al (14), Vasconcelos et al (15), Watts et al (31). 95% CI, 95% confidence interval.
Sensitivity analysis of included studies for musculoskeletal manifestations. (A) Sensitivity analysis of included studies for myalgia. (B) Sensitivity analysis of included studies for arthralgia. (C) Sensitivity analysis of included studies for back pain. The studies included were as follows: Aguilar et al (24), Alvarez-Falconi et al (25), Alva-Urcia et al (26), Azevedo et al (11), Benitez et al (34), Cardoso et al (16), Carvalho et al (17), Castillo et al (27), Ciuoderis et al (36), Cola et al (18), Cravo et al (19), da Costa et al (20), de Lima et al (21), de Melo Iani et al (22), Durango-Chavez et al (28), Gaillet et al (32), Gourjault et al (33), Gravier et al (35), Martins-Luna et al (29), Moreira et al (2), Morrison et al (37), Mourão et al (23), Naveca et al (12), Pinheiro et al (13), Silva-Caso et al (30), Vasconcelos et al (14), Vasconcelos et al (15), Watts et al (31) 95% CI, 95% confidence interval.
Sensitivity analysis of included studies for dermatological manifestations. (A) Sensitivity analysis of included studies for skin rash. (B) Sensitivity analysis of included studies for petechiae. The studies included were as follows: Alvarez-Falconi et al (25), Alva-Urcia et al (26), Cardoso et al (16), Carvalho et al (17), Castillo et al (27), Ciuoderis et al (36), Cola et al (18), Cravo et al (19), da Costa et al (20), de Lima et al (21), Durango-Chavez et al (28), Gaillet et al (32), Gourjault et al (33), Martins-Luna et al (29), Moreira et al (2), Morrison et al (37), Mourão et al (23), Naveca et al (12), Silva-Caso et al (30), Vasconcelos et al (14), Watts et al (31) 95% CI, 95% confidence interval.
Funnel plot assessing publication bias for fever among the included studies.
The detailed search strategy for each database.
Quality appraisal of studies using the modified Newcastle-Ottawa Scale.
Methodological quality assessment of case series/reports using the tool described in the study by Murad et al (10)a.
Acknowledgements
Not applicable.
Funding
Funding: No funding was received.
Availability of data and materials
The data generated in the present study may be requested from the corresponding author.
Authors' contributions
MG and AP conceptualized the study. MG, AP, SKY and YC made a substantial contribution to data interpretation and analysis. MG, AP, SKY and YC wrote and prepared the draft of the manuscript. MG, AP and SKY analyzed the data and provided critical revisions. MG and AP confirm the authenticity of all the raw data. All authors contributed to the manuscript revision and have read and approved the final version of the manuscript.
Ethics approval and consent to participate
Not applicable.
Patient consent for publication
Not applicable.
Competing interests
The authors declare that they have no competing interests.
References
|
Wesselmann KM, Postigo-Hidalgo I, Pezzi L, de Oliveira-Filho EF, Fischer C, de Lamballerie X and Drexler JF: Emergence of Oropouche fever in latin america: A narrative review. Lancet Infect Dis. 24:e439–e452. 2024.PubMed/NCBI View Article : Google Scholar | |
|
Moreira HM, Sgorlon G, Queiroz JAS, Roca TP, Ribeiro J, Teixeira KS, Passos-Silva AM, Araújo A, Gasparelo NWF, Dos Santos A de O, et al: Outbreak of Oropouche virus in frontier regions in western Amazon. Microbiol Spect. 12(e0162923)2024.PubMed/NCBI View Article : Google Scholar | |
|
Dinh T, Kanji J and Vaughan S: Oropouche virus. CMAJ. 197(E244)2025.PubMed/NCBI View Article : Google Scholar | |
|
Scachetti GC, Forato J, Claro IM, Hua X, Salgado BB, Vieira A, Simeoni CL, Barbosa ARC, Rosa IL, de Souza GF, et al: Re-emergence of Oropouche virus between 2023 and 2024 in Brazil: An observational epidemiological study. Lancet Infect Dis. 25:166–175. 2025.PubMed/NCBI View Article : Google Scholar | |
|
Douglas KO: The silent invaders: Oropouche and Melao viruses, causes of increased public health risks for the Americas. Infect Dis (London). 56:1009–1014. 2024.PubMed/NCBI View Article : Google Scholar | |
|
Rodriguez-Morales AJ and Drexler JF: Re-emergence of Oropouche virus in Brazil and Latin America. Lancet Infect Dis. 25:137–139. 2025.PubMed/NCBI View Article : Google Scholar | |
|
Files MA, Hansen CA, Herrera VC, Schindewolf C, Barrett ADT, Beasley DWC, Bourne N and Milligan GN: Baseline mapping of Oropouche virology, epidemiology, therapeutics, and vaccine research and development. NPJ Vaccines. 7(38)2022.PubMed/NCBI View Article : Google Scholar | |
|
Moher D, Liberati A, Tetzlaff J and Altman DG: PRISMA Group. Preferred reporting items for systematic reviews and meta-analyses: The PRISMA statement. PLoS Med. 6(e1000097)2009.PubMed/NCBI View Article : Google Scholar | |
|
Wells G, Shea B, O'Connell D, Roberton J, Peterson J, Welch V, Losos M and Tugwell : The Newcastle-Ottawa Scale (NOS) for Assessing the Quality of Nonrandomised Studies in Meta-Analyses. Ottawa Hospital Research Institute, Ottawa, ON, 2014. | |
|
Murad MH, Sultan S, Haffar S and Bazerbachi F: Methodological quality and synthesis of case series and case reports. BMJ Evid Based Med. 23:60–63. 2018.PubMed/NCBI View Article : Google Scholar | |
|
Azevedo RS, Nunes MR, Chiang JO, Bensabath G, Vasconcelos HB, Pinto AY, Martins LC, Monteiro HA, Rodrigues SG and Vasconcelos PF: Reemergence of Oropouche fever, northern Brazil. Emerg Infect Dis. 13:912–915. 2007.PubMed/NCBI View Article : Google Scholar | |
|
Naveca FG, Almeida TAP, Souza V, Nascimento V, Silva D, Nascimento F, Mejía M, Oliveira YS, Rocha L, Xavier N, et al: Human outbreaks of a novel reassortant Oropouche virus in the Brazilian Amazon region. Nat Med. 30:3509–3521. 2024.PubMed/NCBI View Article : Google Scholar | |
|
Pinheiro FP, Travassos da Rosa AP, Travassos da Rosa JF and Bensabath G: An outbreak of Oropouche virus diease in the vicinity of santarem, para, Barzil. Tropenmed Parasitol. 27:213–223. 1976.PubMed/NCBI | |
|
Vasconcelos PF, Travassos Da Rosa JF, Guerreiro SC, Dégallier N, Travassos Da Rosa ES and Travassos Da Rosa AP: 1st register of an epidemic caused by Oropouche virus in the states of Maranhão and Goiás, Brazil. Rev Inst Med Trop Sao Paulo. 31:271–278. 1989.PubMed/NCBI View Article : Google Scholar : (In Portuguese). | |
|
Vasconcelos HB, Azevedo RSS, Casseb SM, Nunes-Neto JP, Chiang JO, Cantuária PC, Segura MN, Martins LC, Monteiro HAO, Rodrigues SG, et al: Oropouche fever epidemic in Northern Brazil: Epidemiology and molecular characterization of isolates. J ClinVirol. 44:129–133. 2009.PubMed/NCBI View Article : Google Scholar | |
|
Cardoso BF, Serra OP, Heinen LB, Zuchi N, Souza VC, Naveca FG, Santos MA and Slhessarenko RD: Detection of Oropouche virus segment S in patients and inCulex quinquefasciatus in the state of Mato Grosso, Brazil. Mem Inst Oswaldo Cruz. 110:745–754. 2015.PubMed/NCBI View Article : Google Scholar | |
|
Carvalho VL, Azevedo RSS, Carvalho VL, Azevedo RS, Henriques DF, Cruz ACR, Vasconcelos PFC and Martins LC: Arbovirus outbreak in a rural region of the Brazilian Amazon. J Clin Virol. 150–151. (105155)2022.PubMed/NCBI View Article : Google Scholar | |
|
Cola JP, Dos Santos APB, Zanotti RL, Dela Costa AEDS, Del Carro KB, Coelho LAL, Miranda AE and Vicente CR: Maternal and fetal implications of Oropouche fever, Espírito Santo State, Brazil, 2024. Emerg Infect Dis. 31:645–651. 2025.PubMed/NCBI View Article : Google Scholar | |
|
Cravo A: Oropouche fever: A retrospective look at a decade (unpublished thesis). MS/SVS/Evandro Chagas Institute, 2021. https://patua.iec.gov.br/items/bf0bb3b8-1131-4fa4-b7b3-c48a385c9fdd. | |
|
da Costa VG, de Rezende Féres VC, Saivish MV, de Lima Gimaque JB and Moreli ML: Silent emergence of Mayaro and Oropouche viruses in humans in Central Brazil. Int J Infect Dis. 62:84–85. 2017.PubMed/NCBI View Article : Google Scholar | |
|
de Lima STS, Hua X, Claro IM, Filho CG, Simões Mello LM, de Jesus R, Bleichrodt A, Maia AMPC, Máximo ACBM, Cavalcante KF, et al: Molecular epidemiology of Oropouche virus, ceará state, brazil, 2024. Emerg Infect Dis. 31:838–842. 2025.PubMed/NCBI View Article : Google Scholar | |
|
de Melo Iani FC, Pereira FM, de Oliveira EC, Rodrigues JTN, Machado MH, Fonseca V, Adelino TER, Guimarães NR, Tomé LMR, Gómez MKA, et al: Travel-associated international spread of Oropouche virus beyond the Amazon. J Travel Med. 32(taaf018)2025.PubMed/NCBI View Article : Google Scholar | |
|
Mourãão MPG, Bastos MS, Gimaqu JB, Mota BR, Souza GS, Grimmer GH, Galusso ES, Arruda E and Figueiredo LT: Oropouche fever outbreak, Manaus, Brazil, 2007-2008. Emerg Infect Dis. 15:2063–2064. 2009.PubMed/NCBI View Article : Google Scholar | |
|
Aguilar PV, Barrett AD, Saeed MF, Watts DM, Russell K, Guevara C, Ampuero JS, Suarez L, Cespedes M, Montgomery JM, et al: Iquitos virus: A novel reassortant Orthobunyavirus associated with human illness in Peru. PLoS Negl Trop Dis. 5(e1315)2011.PubMed/NCBI View Article : Google Scholar | |
|
Alvarez-Falconi PP and Ríos Ruiz BA: Oropuche fever outbreak in Bagazan, San Martin, Peru: Epidemiological evaluation, gastrointestinal and hemorrhagic manifestations. Rev Gastroenterol Peru. 30:334–340. 2010.PubMed/NCBI | |
|
Alva-Urcia C, Aguilar-Luis MA, Palomares-Reyes C, Silva-Caso W, Suarez-Ognio L, Weilg P, Manrique C, Vasquez-Achaya F, Del Valle LJ and Del Valle-Mendoza J: Emerging and reemerging arboviruses: A new threat in Eastern Peru. PLoS One. 12(e0187897)2017.PubMed/NCBI View Article : Google Scholar | |
|
Castillo Oré RM, Caceda RE, Huaman AA, Williams M, Hang J, Juarez DE, Kochel TJ, Halsey ES and Forshey BM: Molecular and antigenic characterization of group C Orthobunya viruses isolated in Peru. PLoS One. 13(e0200576)2018.PubMed/NCBI View Article : Google Scholar | |
|
Durango-Chavez HV, Toro-Huamanchumo CJ, Silva-Caso W, Martins-Luna J, Aguilar-Luis MA, Del Valle-Mendoza J and Puyen ZM: Oropouche virus infection in patients with acute febrile syndrome: Is a predictive model based solely on signs and symptoms useful? PLoS One. 17(e0270294)2022.PubMed/NCBI View Article : Google Scholar | |
|
Martins-Luna J, Del Valle-Mendoza J, Silva-Caso W, Sandoval I, Del Valle LJ, Palomares-Reyes C, Carrillo-Ng H, Peña-Tuesta I and Aguilar-Luis MA: Oropouche infection a neglected arbovirus in patients with acute febrile illness from the Peruvian coast. BMC Res Notes. 13(67)2020.PubMed/NCBI View Article : Google Scholar | |
|
Silva-Caso W, Aguilar-Luis MA, Palomares-Reyes C, Mazulis F, Weilg C, Del Valle LJ, Espejo-Evaristo J, Soto-Febres F, Martins-Luna J and Del Valle-Mendoza J: First outbreak of Oropouche fever reported in a non-endemic western region of the Peruvian Amazon: Molecular diagnosis and clinical characteristics. Int J Infect Dis. 83:139–144. 2019.PubMed/NCBI View Article : Google Scholar | |
|
Watts DM, Russell KL, Wooster MT, Sharp TW, Morrison AC, Kochel TJ, Bautista CT, Block K, Guevara C, Aguilar P, et al: Etiologies of acute undifferentiated febrile illnesses in and near iquitos from 1993 to 1999 in the Amazon river basin of Peru. Am J Trop Med Hyg. 107:1114–1128. 2022.PubMed/NCBI View Article : Google Scholar | |
|
Gaillet M, Pichard C, Restrepo J, Lavergne A, Perez L, Enfissi A, Abboud P, Lambert Y, Ma L, Monot M, et al: Outbreak of Oropouche virus in French Guiana. Emerg Infect Dis. 27:2711–2714. 2021.PubMed/NCBI View Article : Google Scholar | |
|
Gourjault C, Pezzi L, Doudier B, Minodier P, Klitting R, Cano P, Ayhan N, Touret F, Grard G, Durand GA, et al: Persistence of Oropouche virus in body fluids among imported cases in France, 2024. Lancet Infect Dis. 25:e64–e65. 2025.PubMed/NCBI View Article : Google Scholar | |
|
Benitez AJ, Alvarez M, Perez L, Gravier R, Serrano S, Hernandez DM, Perez MM, Gutierrez-Bugallo G, Martinez Y, Companioni A, et al: Oropouche fever, Cuba, May 2024. Emerg Infect Dis. 30:2155–2159. 2024.PubMed/NCBI View Article : Google Scholar | |
|
Gravier R, Perez MM, Alvarez M, Perez L, Benítez AJ, Hernández D, Serrano S, de Armas Fernández JR, Peña C, Rivera M, et al: Countrywide spread and spatiotemporal diffusion dynamics of Oropouche virus in Cuba, 2024. The Lancet: 1-19, 2025. | |
|
Ciuoderis KA, Berg MG, Perez LJ, Hadji A, Perez-Restrepo LS, Aristizabal LC, Forberg K, Yamaguchi J, Cardona A, Weiss S, et al: Oropouche virus as an emerging cause of acute febrile illness in Colombia. Emerg Microbes Infect. 11:2645–2657. 2022.PubMed/NCBI View Article : Google Scholar | |
|
Morrison A, White JL, Hughes HR, Guagliardo SAJ, Velez JO, Fitzpatrick KA, Davis EH, Stanek D, Kopp E, Dumoulin P, et al: Oropouche virus disease among U.S. travelers-United States, 2024. MMWR Morb Mortal Wkly Rep. 73:769–773. 2024.PubMed/NCBI View Article : Google Scholar | |
|
Wang Z, Huang L, Zhang X, Zhang X, Huang L, Zhu X, Long X, Cao D and Li Y: Clinical presentation of Oropouche virus infection: A systematic review and meta-analysis. PLoS Negl Trop Dis. 19(e0012962)2025.PubMed/NCBI View Article : Google Scholar | |
|
Tortosa F, Gutiérrez Castillo G, Izcovich A, Luz K, Dos Santos T, Gonzalez-Escobar G, Ragusa MA, Gresh L, Mendez-Rico JA and Reveiz L: Key clinical manifestations to differentiate Oropouche fever from dengue and other arboviral diseases: A living systematic review. Am J Public Health. 48(e136)2024.PubMed/NCBI View Article : Google Scholar | |
|
Pereira R, Souza P, Carvalho L, Nizer W and Lima W: Epidemiological aspects of the Oropouche virus (Orthobunyavirus) in South America: A systematic review. Revista Colombiana de Ciencias Químico Farmacéuticas. 51:166–184. 2022. | |
|
Kharwadkar S and Herath N: Clinical manifestations of dengue, Zika and chikungunya in the Pacific Islands: A systematic review and meta-analysis. Rev Med Virol. 34(e2521)2024.PubMed/NCBI View Article : Google Scholar |