Integrated multi‑omics analysis of liver metabolic dysregulation in ACE2 knockout mice
- Authors:
- Published online on: July 3, 2025 https://doi.org/10.3892/ijmm.2025.5575
- Article Number: 134
-
Copyright: © Xiao et al. This is an open access article distributed under the terms of Creative Commons Attribution License.
Abstract
Introduction
Angiotensin-converting enzyme 2 (ACE2) is a type I transmembrane glycoprotein with monocarboxypeptidase activity and serves a pivotal regulatory role in maintaining physiological homeostasis (1). This enzyme catalyzes the conversion of angiotensin II (AngII) to angiotensin-(1-7) [Ang-(1-7)], which activates the Mas receptor (MasR)-mediated nitric oxide (NO)-cGMP signaling pathway, thereby counteracting vascular constriction, oxidative stress and fibrosis induced by AngII/angiotensin II receptor type 1 (AT1R) axis activationefardc (2,3). Experimental evidence has demonstrated that the flavonoid xanthenone enhanced ACE2 activity to elevate superoxide dismutase (SOD) and glutathione peroxidase (GPx) enzymatic functions while inhibiting p47phox subunit membrane translocation, establishing multitarget antioxidant defense mechanisms (4). The therapeutic potential of ACE2 in cardiovascular pathologies stems from its ability to balance the ACE/AT1R and ACE2/Ang-(1-7)/MasR axes within the renin-angiotensin system (RAS), which effectively ameliorates vascular remodeling in hypertensive models (5,6). In addition to cardiovascular regulation, ACE2 exerts anti-inflammatory effects by suppressing pro-inflammatory cytokines (TNF-α, IL-6 and IL-1β) and modulating NF-κB/MAPK signaling cascades (7). This enzyme further modulates macrophage polarization by suppressing M1 pro-inflammatory phenotypes while promoting M2 anti-inflammatory differentiation, thereby maintaining the systemic immune equilibrium (8). Neuropathological investigation has revealed that cortical ACE2 downregulation following traumatic brain injury impaired ACE2/Ang-(1-7)/MasR signaling, concomitant with pyroptosis-related gene upregulation (Gsdmd, Casp1, Il18rap and Illr2) and elevated IL-1β/IL-18 release, which in turn enhanced microglial phagocytic activity and pro-inflammatory transformation, exacerbating secondary neuronal damage and blood-brain barrier disruption (9). Paradoxically, in COVID-19 pathogenesis, ACE2 serves dual roles as both the severe acute respiratory syndrome coronavirus 2 (SARS-CoV-2) entry receptor and a critical RAS regulator, and viral spike protein binding induces ACE2 downregulation, causing AngII/AT1R axis overactivation, which exacerbates oxidative stress, cytokine storms and multi-organ dysfunction through increased vascular permeability (10,11).
The liver, as the principal metabolic organ, orchestrates systemic homeostasis by regulating glucose-lipid metabolism, bile acid synthesis and detoxification processes (12-14). Hepatic dysfunction critically contributes to metabolic syndrome, non-alcoholic fatty liver disease (NAFLD) and fibrotic progression (13,15). Although ACE2 has a broad tissue distribution (pulmonary, cardiovascular, renal and gastrointestinal) (1,16,17), its hepatic expression remains comparatively low, yet functionally significant in metabolic regulation and fibrotic suppression (6,18). Experimental models have revealed ACE2-mediated attenuation of hepatic AngII concentrations with concurrent Ang-(1-7) elevation, effectively inhibiting hepatic stellate cell (HSC) activation and periductular fibrosis (19). Single-cell transcriptomic analysis has confirmed that Ang-(1-7), via MasR binding, suppressed α-smooth muscle actin expression and type I collagen secretion in HSCs, counteracting ACE/AngII/AT1R-mediated fibrogenesis (16). In septic liver injury, ACE2 mitigates hepatocellular inflammation by downregulating the toll like receptor 4/NF-κB and MAPK signaling pathways, thereby reducing TNF-α, IL-1β and IL-6 production (20). Metabolically, the ACE2/Ang-(1-7)/MasR axis enhances insulin sensitivity by activating the Akt signaling pathway and modulating the ATP/P2 receptor/calmodulin signaling pathway (21). ACE2 deletion exacerbates NAFLD progression, manifested by elevated malondialdehyde levels, impaired SOD/GPx antioxidant activities and aggravated hepatic lipid accumulation with concomitant IL-6/TNF-α elevation in murine models (22,23). This multidimensional regulatory network positions ACE2 as a crucial modulator of hepatic metabolic equilibrium and anti-fibrotic defense mechanisms. Elucidating the hepatic interactions of ACE2 may not only clarify the central role of the liver in systemic metabolic regulation but also identify novel diagnostic biomarkers and therapeutic targets for hepatic pathologies.
In contemporary biomedical research, the mature application of omics has become a critical tool for unraveling the complex molecular mechanisms underlying various diseases. By capturing biological information across different organizational levels, these technologies provide robust data support to construct comprehensive regulatory networks that span gene expression to final metabolic products (24). For instance, transcriptomics not only comprehensively records gene expression levels, but also precisely captures subtle changes in upstream regulatory signals. Proteomics, as an intermediate step, focuses on protein expression and post-translational modifications. Metabolomics, on the other hand, emphasizes metabolic regulators and end products, providing critical evidence for elucidating the molecular mechanisms of glucose-lipid metabolic disorders induced by ACE2 deletion, which also demonstrates the significance of metabolomics in analyzing disease-specific metabolic remodeling (25). The integrated application of multi-omics data not only offers novel biological insights, but also reveals complementary perspectives on biological processes (BPs) across different levels, aiding the identification of disease biomarkers and therapeutic targets (26). Therefore, the present study aimed to investigate the impact of ACE2-knockout (ACE2KO) on hepatic metabolic networks in mice using multi-omics analysis to provide mechanistic insights into ACE2-associated hepatopathology.
Materials and methods
Experimental animals
Male ACE2KO mice (8 weeks old) were obtained from SPF (Beijing) Biotechnology Co., Ltd., and male C57BL/6J wild-type controls (8 weeks old) were procured from Pengyue Laboratory Animal Technology Co., Ltd. Each experimental group comprised 8 animals (16 animals in total). The initial body weight of both groups of mice was 19-22 g, with no significant differences observed. Following a 7-day acclimation period under standardized conditions, the mice were maintained in specific pathogen-free facilities with controlled temperature (22±1°C) and humidity (55±5%), and a 12-h light/dark cycle. Standardized husbandry protocols included sterile bedding, autoclaved food/water provided ad libitum and twice-daily health assessments conducted by certified personnel. No incidental mortality occurred during the study period, with all mice undergoing terminal euthanasia according to the experimental endpoints. All the experimental procedures were approved by the Ethics Committee of Jining First People's Hospital (approval no. JNRM-2022-DW-011; Jining, China).
Sample collection
After intraperitoneal injection of sodium pentobarbital (80 mg/kg body weight), mice were euthanized by cervical dislocation. Death was confirmed by respiratory arrest, cardiac cessation and pupillary dilation. Liver tissues were immediately dissected on ice to minimize RNA degradation. A portion of liver was fixed in 4% paraformaldehyde at 4°C for 24 h for histopathological analysis. The remaining tissues were flash-frozen in liquid nitrogen within 90 sec post-excision and stored at -80°C for subsequent experiments.
Biochemical profiling
Hepatic homogenates (10% w/v in PBS) were prepared under cryogenic conditions at 0-4°C, followed by centrifugation at 0-4°C (12,000 × g; 15 min) to obtain supernatant fractions. Triglyceride (TG) and total cholesterol (TC) levels were quantified using commercial kits (TG kit: Triglyceride Assay Kit, JL-T0853-96, Shanghai Jonlnbio Industrial Co., Ltd.; TC kit: Total Cholesterol Assay Kit, JL-T1371-96, Shanghai Jonlnbio Industrial Co., Ltd.) with absorbance measurements recorded at 546 and 500 nm, respectively, using a Varioskan LUX microplate reader (Thermo Fisher Scientific, Inc.). AngII and Ang-(1-7) levels were assessed using ELISAs (Cusabio Technology, LLC; Mouse angiotensin Ⅱ ELISA Kit; CSB-E04495m; Mouse Angiotensin 1-7 ELISA Kit; CSB-E13763m; both at 450 nm). All measurements were subjected to BCA protein normalization with quality controls, which demonstrated <5% intra-assay variability.
H&E staining
Hepatic specimens underwent ethanol dehydration after chemical fixation and were paraffin-embedded. Microtome-cut sections (≤8 µm) were mounted on slides. Dewaxing with xylene and graded ethanol preceded hematoxylin staining for 5 min at room temperature and eosin staining for 5 min at room temperature. After washing and dehydration, sections were air-dried, mounted with neutral gum and evaluated using a calibrated Olympus BX53 light microscope (Olympus Corporation).
Western blotting
Hepatic tissues were homogenized in RIPA buffer (containing 50 mM Tris-HCl pH 8.0, 150 mM NaCl, 1% NP-40, 0.5% sodium deoxycholate, 0.1% SDS and 1 mM PMSF; cat. no. R0010; Beijing Solarbio Science & Technology Co., Ltd.) and centrifuged at 12,000 × g for 15 min at 4°C to obtain soluble fractions. Protein concentrations were determined using a BCA assay (cat. no. A65453; Thermo Fisher Scientific, Inc.). Aliquots containing 20 µg of protein were mixed with loading buffer and denatured by boiling at 95°C for 10 min, and subsequently loaded onto the gel at 20 µg per lane. Samples were electrophoresed on 10% SDS-PAGE gels and transferred onto PVDF membranes. The membranes were blocked with 5% non-fat milk in TBS with 0.1% Tween-20 for 1 h at room temperature. After blocking, the membranes were incubated with anti-ACE2 (ab108252; 1:1,000; Abcam) primary antibody overnight at 4°C. For the actin loading control, the membranes were incubated with anti-β-actin primary antibody (20536-1-AP; 1:1,000; Proteintech Group, Inc.) overnight at 4°C. Membranes were incubated with HRP-conjugated goat anti-mouse IgG secondary antibody (7076S; 1:5,000; Cell Signaling Technology, Inc.) for 1 h at room temperature, and ECL substrate (Santa Cruz Biotechnology, Inc.) was used for chemiluminescence detection. Band intensities were semi-quantified using infrared imaging and analyzed using ImageJ (version 1.54i; National Institutes of Health) and GraphPad Prism 10 (Dotmatics).
Reverse transcription-quantitative PCR (RT-qPCR)
Total RNA was isolated from hepatic tissue using TRIzol reagent (Invitrogen; Thermo Fisher Scientific, Inc.) and a spectrophotometer was used for quality verification (A260/A280 >1.8). Reverse transcription was performed at 37°C for 15 min, followed by 85°C for 5 sec using FastKing gDNA Dispelling RT SuperMix (Tiangen Biotech Co., Ltd.) for cDNA synthesis. The reference gene used was β-actin. Target-specific primers (Table I) were synthesized by Beijing Tsingke Biotech Co., Ltd. The PCR reaction (20 µl) contained SYBR Green Premix (Roche Diagnostics), cDNA (50 ng) and primers (0.2 µM each). The cycling parameters were as follows: 95°C for 15 min; 40 cycles of 95°C for 10 sec and 60°C for 20-32 sec. Melting curve analysis was used to confirm the specificity. Relative gene expression was calculated using the 2−ΔΔCq method and normalized to β-actin, based on the equation from Livak and Schmittgen (27).
Transcriptomics analysis
Total RNA was isolated from hepatic tissue using the mirVana™ miRNA ISOlation Kit (cat. no. 1561; Ambion; Thermo Fisher Scientific, Inc.). The RNA integrity number (>8.0) was assessed using an Agilent 2100 Bioanalyzer (Agilent Technologies, Inc.). Libraries were constructed using the TruSeq Stranded mRNA LT Sample Prep Kit (cat. no. RS-122-2101; Illumina, Inc.). The final library concentration (4 nM) was determined using the Agilent 2100 Bioanalyzer. For PCR amplification, the VAHTS HiFi Amplification Mix 3 and PCR Primer Mix 6 for Illumina from the VAHTS Universal V10 RNA-seq Library Prep Kit (Premixed Version) (cat. no. NR616-02; Vazyme Biotech Co., Ltd.) were used. The VAHTS Maxi Unique Dual Index Primers Set 1-Set 4 for Illumina (cat. no. N34401/N34402/N34403/N34404-01; Vazyme Biotech Co., Ltd.) were employed to ensure dual-index marking of the DNA libraries, minimizing index hopping and misassignment. The thermocycling conditions were as follows: 98°C for 30 sec, followed by 15 cycles of 98°C for 10 sec, 60°C for 30 sec and 72°C for 30 sec, with a final extension at 72°C for 5 min. The percentage of the agarose gel used was 1.5%, and the visualization method was ethidium bromide staining at room temperature for 20-30 min. Paired-end sequencing with a read length of 150 base pairs on each end was performed on an Illumina NovaSeq 6000 platform (Illumina, Inc.) with the NovaSeq 6000 S4 Reagent Kit (cat. no. 20028712; Illumina, Inc.), generating ~40 million reads per sample. Raw reads were processed with Trimmomatic v0.39 (28). Clean reads were mapped to the reference genome using HISAT2 v2.2.1 (29). Fragments per kilobase of transcript per million mapped reads (FPKM) values were calculated using Cufflinks v2.2.1 (30), and differential expression analysis was conducted with DESeq2 v1.36.0 (https://bioconductor.org/packages/release/bioc/html/DESeq2.html), identifying genes with |log2 fold change (FC)|>1 and q<0.05. The R packages pheatmap (v1.0.12; https://cran.r-project.org/package=pheatmap), ggplot2 (v3.5.2; https://ggplot2.tidyverse.org/) and networkD3 (v0.5; https://christophergandrud.github.io/networkD3/) were used to generate heatmaps, volcano plots and Sankey diagrams, showing gene expression clustering, differential expression and metabolite relationships. Functional annotation involved Gene Ontology (GO; http://geneontology.org/) and Kyoto Encyclopedia of Genes and Genomes (KEGG; https://www.genome.jp/kegg/) pathway enrichment analysis.
Proteomics analysis
Hepatic tissues were homogenized in ice-cold lysis buffer (8 M urea, 1% SDS and protease inhibitors) using a high-throughput tissue homogenizer (3×40 sec cycles), followed by incubation on ice (30 min) and centrifugation (16,000 × g; 30 min; 4°C). The protein concentration was quantified using a BCA assay, and integrity was verified by 12% SDS-PAGE (15 µg/lane). Aliquots (100 µg protein) were reduced with 10 mM tris (2-carboxyethyl) phosphine (37°C; 60 min), alkylated with 40 mM iodoacetamide (room temperature; 40 min), precipitated with acetone and digested overnight with trypsin (1:50 enzyme-to-substrate ratio) at 37°C. Peptides were labeled with TMTpro 16plex reagents (100 µg peptides per tube; incubation at room temperature for 2 h), quenched with hydroxylamine at room temperature for 30 min, pooled and prefractionated via high-pH reversed-phase liquid chromatography (C18 column; pH 10) into 14 consolidated fractions. Liquid-chromatography tandem mass spectrometry analysis was performed on an Orbitrap Exploris 480 system (Thermo Fisher Scientific, Inc.) coupled to an Evosep One system (Evosep Biosystems) using a C18 column (150 µm x 15 cm) with a 44-min gradient (0.1% formic acid/acetonitrile). Full mass spectrometry scans (60,000 resolution; m/z 350-1,500) and higher-energy collisional dissociation tandem mass spectrometry (15,000 resolution; 28% normalized collision energy) were acquired in positive ionization mode using nitrogen gas at a temperature of 300°C, nebulizer pressure of 7.2519 psi (0.5 bar) and flow rate of 1 l/min. Raw data were processed using MaxQuant software (version 2.1.0.0; http://www.maxquant.org) for label-free quantification, identifying differentially expressed proteins (DEPs; P<0.05; |log2FC|>0.263). Functional enrichment analysis (GO/KEGG pathways) was conducted using the Database for Annotation, Visualization, and Integrated Discovery (version 6.8; https://david.ncifcrf.gov/), and protein interaction networks were mapped using the Search Tool for the Retrieval of Interacting Genes/Proteins database (version 11.5; https://string-db.org/) followed by visualization in Cytoscape software (version 3.9.1; https://cytoscape.org/).
Metabolomics analysis
Hepatic tissues were homogenized in a methanol-acetonitrile-water mixture [2:2:1; v/v/v; with the second solvent (acetonitrile) representing a 100% volumetric increase relative to the first solvent (methanol) based on the provided ratio] using cryogenic grinding, followed by ultrasonication in an ice-water bath and low-temperature centrifugation (14,800 × g; 15 min) at 4°C to collect supernatants with a volume of 150 µl. L-2-chlorophenylalanine (0.3 mg/ml) was used as an internal standard during the homogenization process according to the original protocol. Chromatographic separation was performed using an ACQUITY UPLC HSS T3 column (100×2.1 mm; 1.8 µm; Waters Corporation) with 0.1% formic acid in water (A) and acetonitrile (B) as mobile phases at 0.35 ml/min. The sample injection volume was 5 µl, and a gradient elution program with the percentage of B increasing from 5 to 100% throughout the elution process was used. Mass spectrometry analysis was conducted on a Q Exactive HF-X system (Thermo Fisher Scientific, Inc.) operated in dual-polarity electrospray ionization mode (±3.6/-3.2 kV), scanning m/z 100-1,200 with resolutions of 120,000 (MS1) and 7,500 (MS2). Instrument parameters included sheath gas (30 Arb), auxiliary gas (25 Arb) and capillary temperature (350°C). Raw data were processed using Progenesis QI (V2.3; Nonlinear Dynamics; https://www.nonlinear.com/progenesis/qi) for peak alignment and total ion current normalization. Metabolite annotation was achieved using the Human Metabolome Database (HMDB; https://hmdb.ca/), LipidMaps database (http://www.lipidmaps.org/) and METLIN database (https://metlin.scripps.edu/) with a mass tolerance of ±5 ppm. Differential metabolites were identified using orthogonal partial least squares-discriminant analysis (OPLS-DA) with thresholds of variable importance in projection (VIP) >1.0 and P<0.05.
Integrated analysis of metabolomics, transcriptomics and proteomics
Transcriptomic, proteomic and metabolomic datasets were integrated using mixomics for principal component analysis-based discrimination and correlation analyses. Biomarker prioritization employed random forest modeling (500 trees) with Gini importance scoring. Cross-omics associations were assessed using Spearman's correlation (|r|>0.6; P<0.05) between matched gene-protein pairs and metabolites. Shared KEGG pathways were identified through cumulative P-value ranking (-log10ΣP), whereas metabolic networks were reconstructed using KEGG Graphics Markup Language (KGML) files to identify hub pathways via node degree analysis. Data normalization followed omics-specific standards (FPKM, label-free quantification intensity and peak area), with statistical thresholds set as |log2FC|>1 and q<0.05 (transcriptome), |log2FC|>0.263 and P<0.05 (proteome), and VIP>1.0 with P<0.05 (metabolome). Visualization was performed using ggplot2 (version 3.4.0; https://ggplot2.tidyverse.org/) and Cytoscape for interpretable network mapping.
Statistical analysis
Data were analyzed using GraphPad Prism 10.0 (Dotmatics), and the results are presented as the mean ± SD. For comparisons between two independent groups, an unpaired Student's t-test was employed. Pearson correlation coefficients (r) were calculated to assess linear relationships between omics data pairs in the MixOmics analysis of multi-omics data. Each experiment was repeated three times to ensure the reliability and reproducibility of the results. P<0.05 was considered to indicate a statistically significant difference.
Results
ACE2 deletion exacerbates hepatic injury via metabolic dysregulation and RAS imbalance
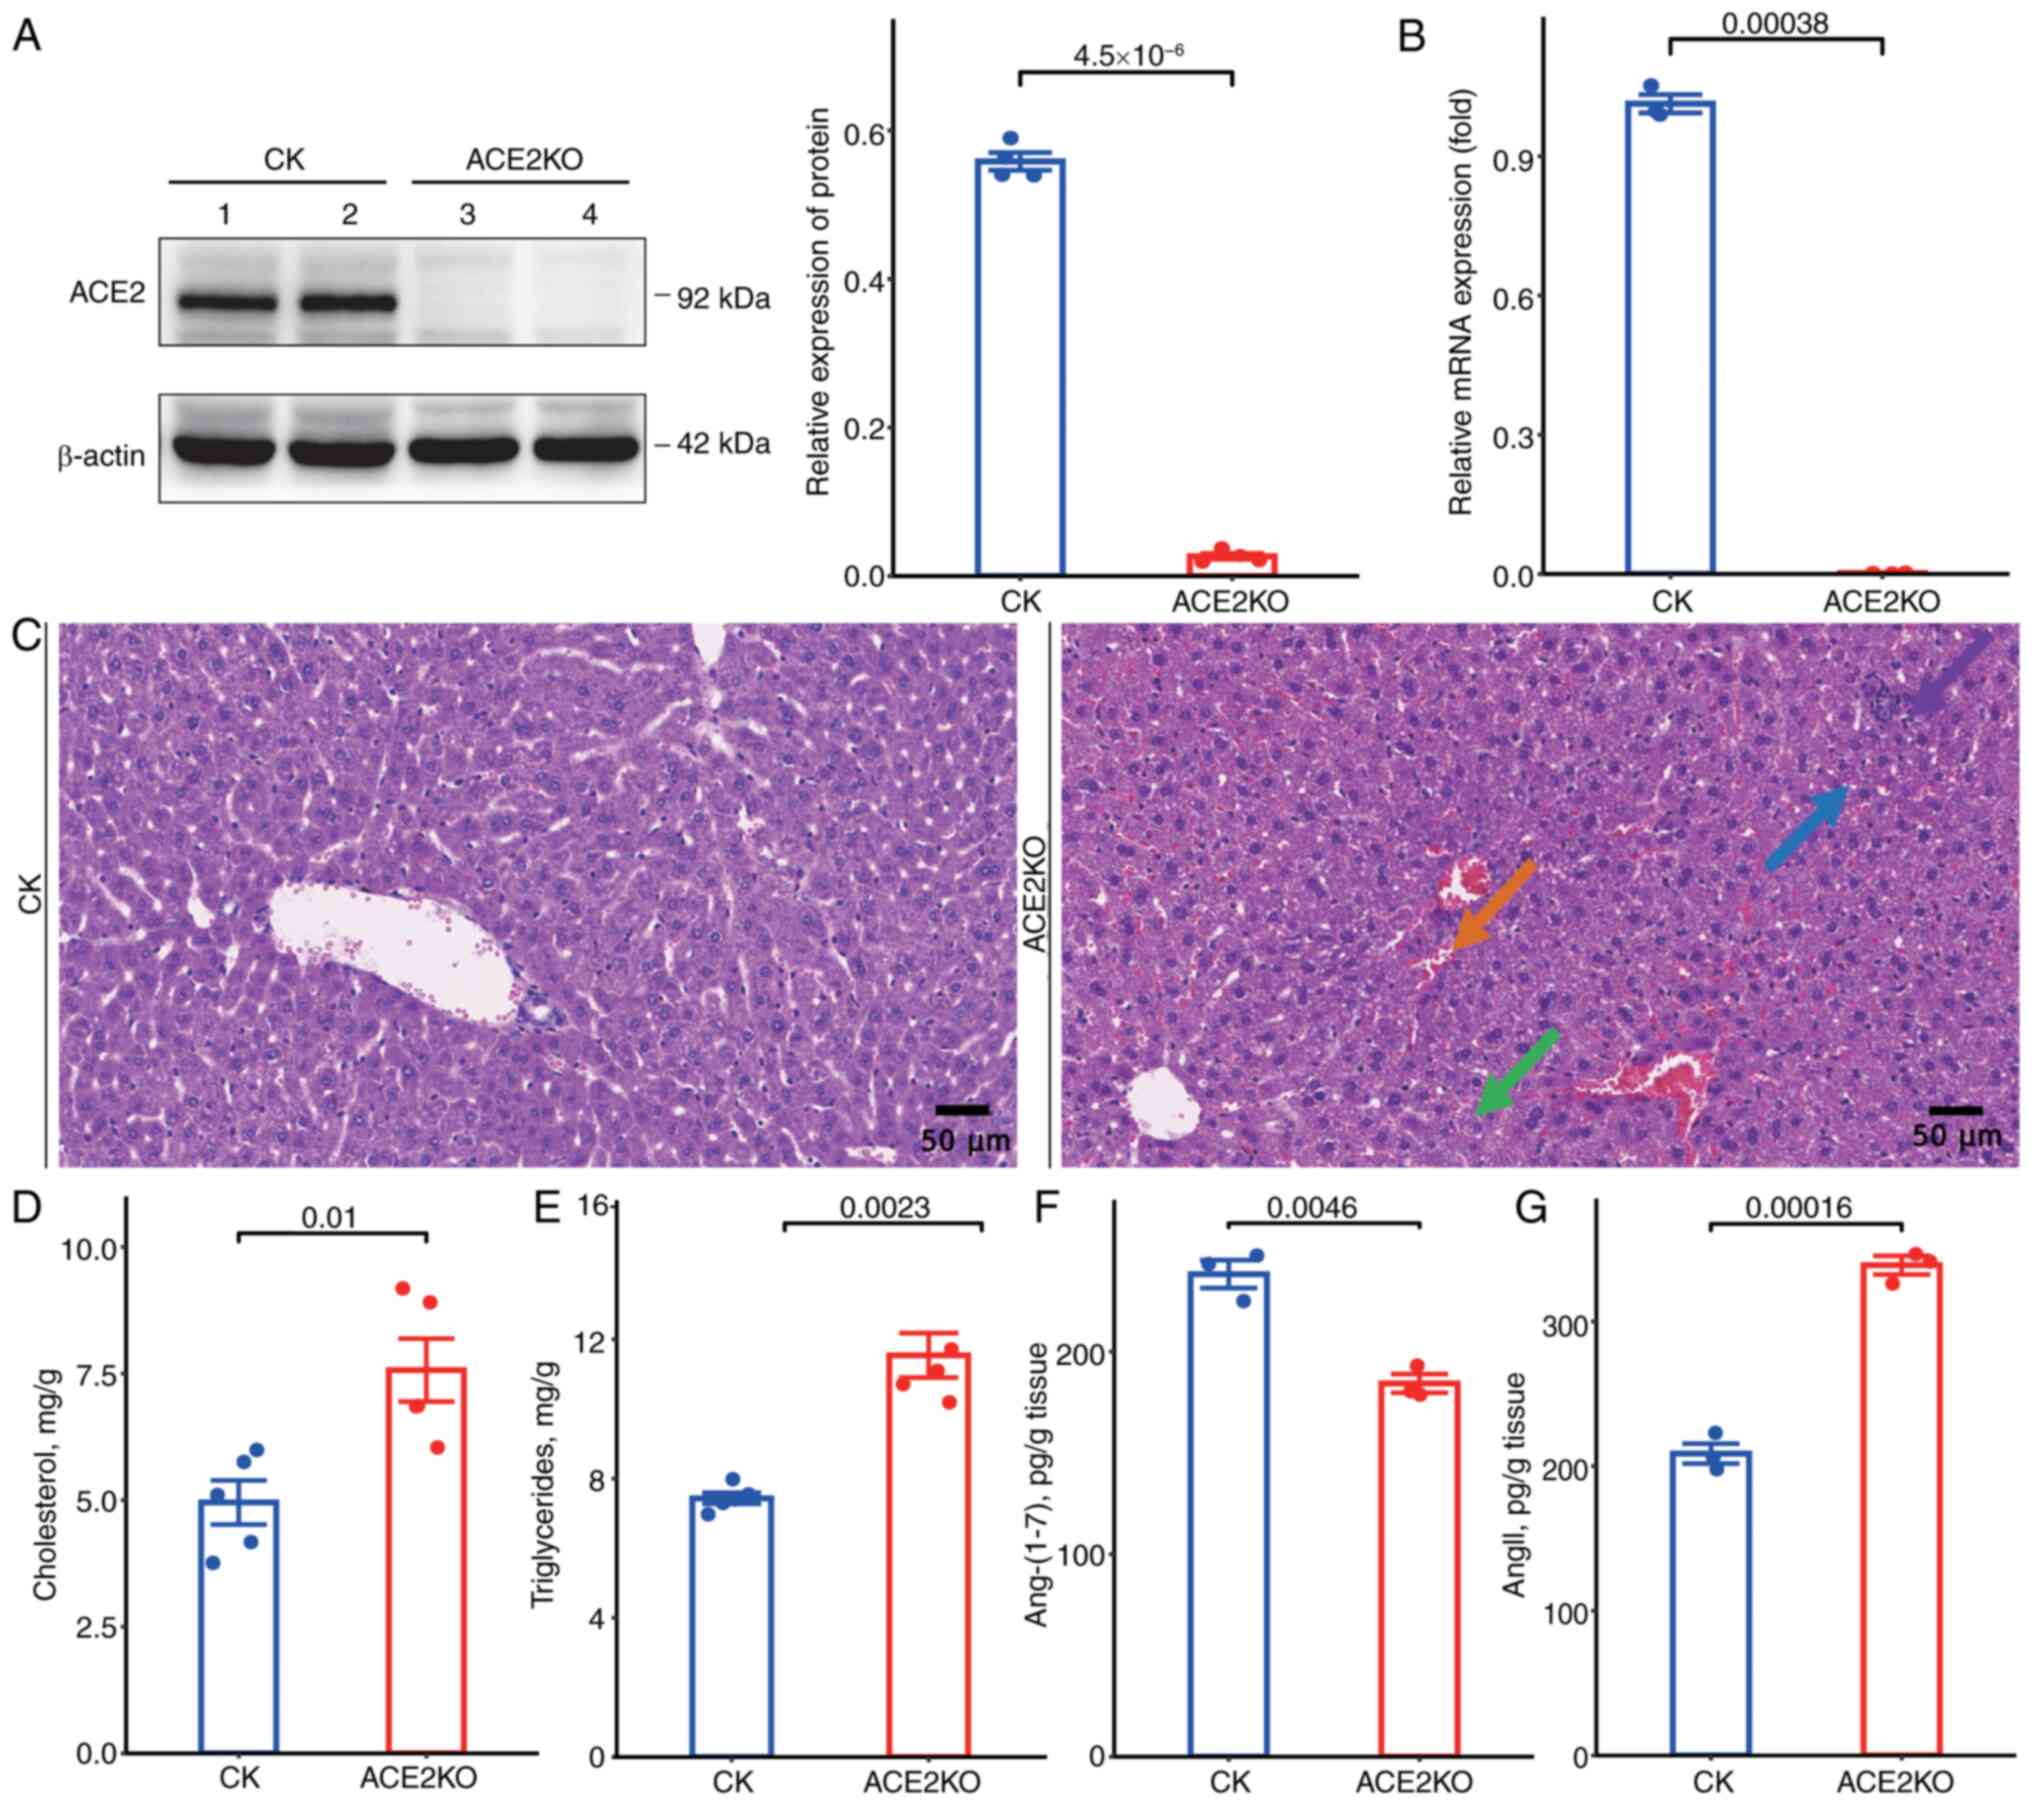
To delineate the phenotypic characteristics of ACE2KO mice, systematic analyses of the hepatic pathology and metabolic alterations were conducted. Western blotting revealed that ACE2 protein was expressed at high levels in the livers of normal mice. However, it was confirmed to be almost completely absent in ACE2KO livers (Fig. 1A), and RT-qPCR demonstrated significantly reduced ACE2 mRNA levels compared with those in wild-type controls (Fig. 1B). Histopathological evaluation using H&E staining revealed mild hepatocyte injury in ACE2KO specimens, characterized by increased hydropic degeneration (green arrow) with cytoplasmic pallor and rarefaction, sporadic vacuolar degeneration (blue arrow) with microvesicular cytoplasmic inclusions, focal lymphocytic infiltrates (purple arrow), and mild sinusoidal stasis (orange arrow) (Fig. 1C). Biochemical profiling demonstrated elevated hepatic TC and TG levels in ACE2KO mice (Fig. 1D and E). ACE2KO concurrently disrupted the RAS equilibrium, marked by significant depletion of Ang-(1-7) (Fig. 1F), accompanied by elevated AngII concentrations (Fig. 1G). These findings demonstrated that ACE2KO potentiated hepatic lipid accumulation and impaired RAS homeostasis, thereby accelerating the progression of liver injury through dual metabolic and endocrine regulatory mechanisms.
Transcriptomic analysis of the control (CK) and ACE2KO groups
The present study employed transcriptomic sequencing to investigate the effects of ACE2KO on hepatic gene expression in mice. Comparative analysis revealed 1,004 differentially expressed genes [DEGs; q-value <0.05 with |log2(FC)|>1] in ACE2KO livers relative to controls, comprising 583 upregulated genes and 421 downregulated genes (Table SI). Expression patterns were visualized using a heatmap (Fig. 2A) and volcano plot (Fig. 2B). Fig. 2C shows the GO enrichment results as a bar graph, depicting the top 10 terms with the lowest P-values for BPs, cellular components (CCs) and molecular functions (MFs). Enriched BPs predominantly included 'response to unfolded protein' and 'lipid metabolic process', which is indicative of cellular stress adaptation and metabolic reprogramming. CC analysis revealed 'endoplasmic reticulum' and 'mitochondrion' involvement, suggesting organelle-specific regulatory alterations. MF analysis highlighted 'oxidoreductase activity' and 'nucleotide binding' functions, reflecting enhanced catalytic and metabolic processes (Table SII). Fig. 2D shows the distribution of DEGs across GO Level 2 terms, providing a broader functional overview.
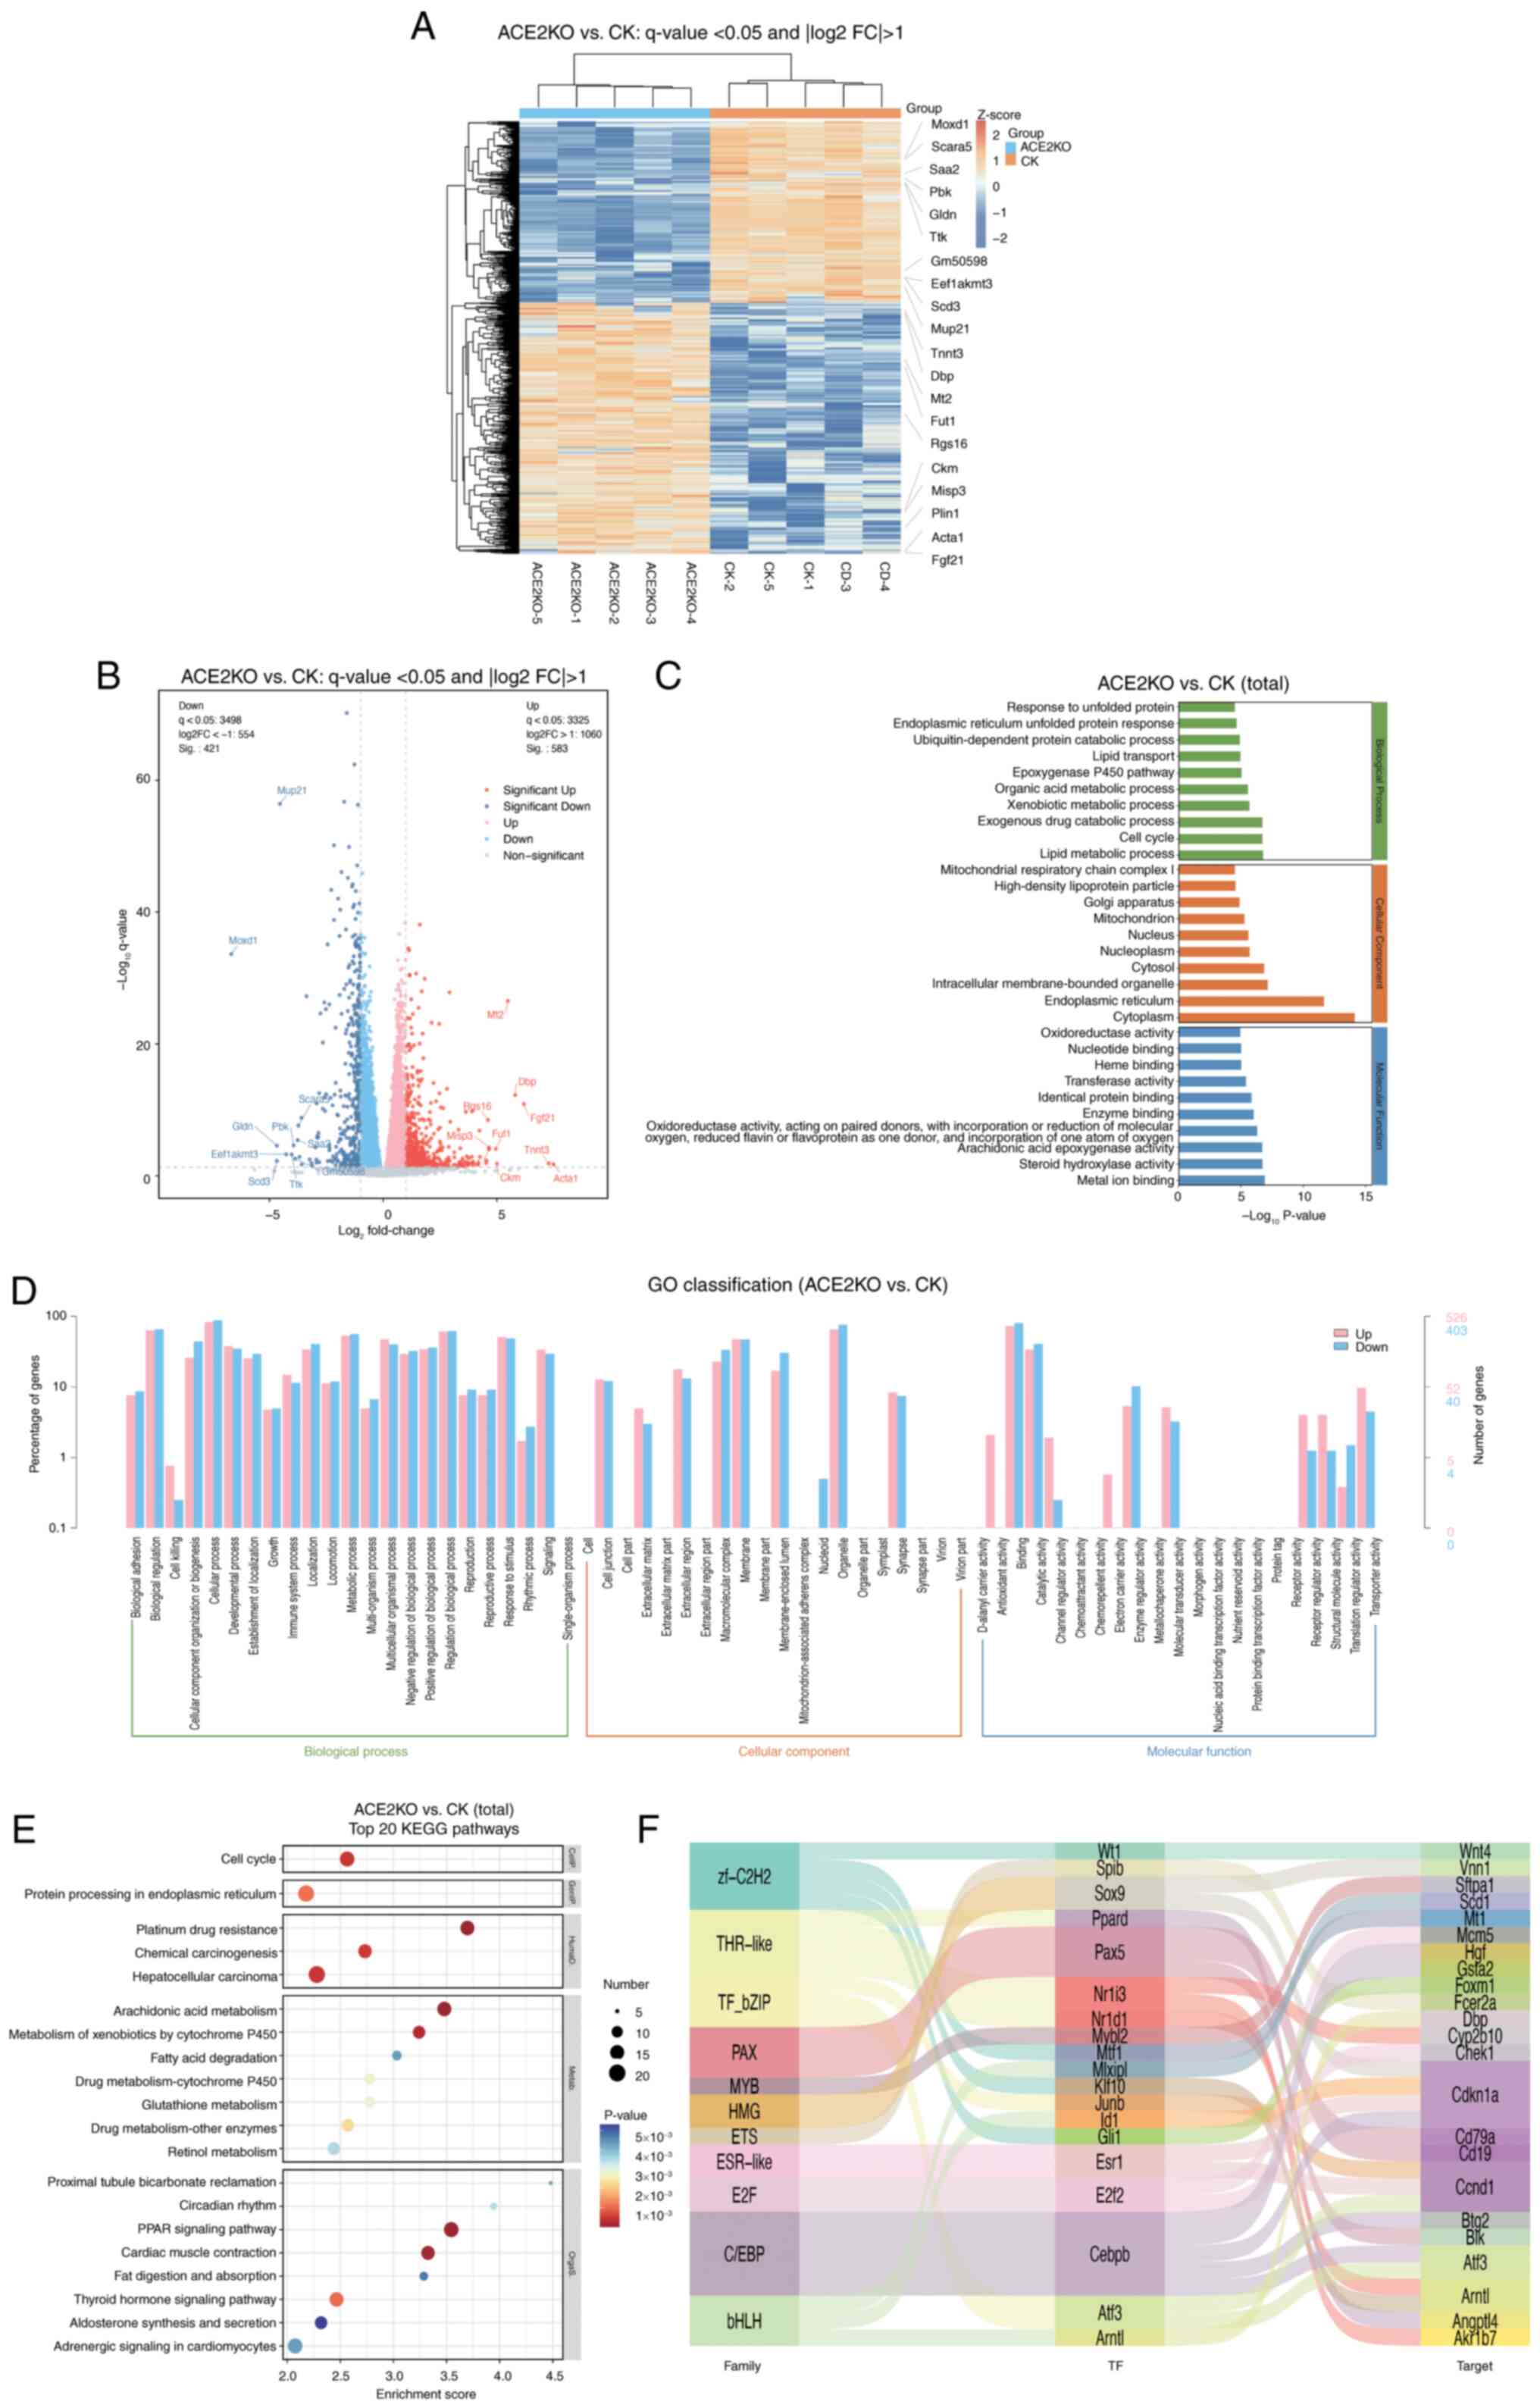
KEGG pathway analysis identified 20 significantly enriched signaling pathways (Fig. 2E). Metabolic pathways, including 'arachidonic acid metabolism' and 'PPAR signaling pathway', were markedly enriched. In 'arachidonic acid metabolism', Cyp4a10, Cyp4a14 and other cytochrome P450 family genes were upregulated. In the 'PPAR signaling pathway', key lipid metabolism genes such as Acsbg1, Plin1, Cpt1b, Cpt1c and Fabp1 were upregulated, while Scd1 and Acsl4 were downregulated, suggesting ACE2KO-mediated disruption of lipid homeostasis. Upregulation of detoxification-related genes (Cbr1 and Gstm1) in the 'metabolism of xenobiotics by cytochrome P450' pathway implied an enhanced xenobiotic detoxification capacity. Notably, 'circadian rhythm' regulation exhibited dysregulation through the downregulation of core clock genes (Arntl and Cry1) and upregulation of Per3, indicating potential chronobiological disruption (Table SIII). Transcriptional regulatory network analysis mapped the interactions between key transcription factors (TFs) and their target DEGs. The Sankey diagram (Fig. 2F) delineates the regulatory relationships involving TFs, including Cebpb, Atf3 and Klf10. Cebpb upregulation activates the antioxidant gene Gsta2, while suppressing the cell cycle inhibitor Cdkn1a, potentially promoting hepatocyte proliferation through the dual mechanisms of oxidative stress tolerance and cell cycle deregulation. Atf3 self-activation establishes a positive feedback loop amplifying endoplasmic reticulum stress signals, which is associated with elevated apoptosis. Concurrent Arntl suppression disrupted the hepatic metabolic rhythmicity, likely contributing to lipid accumulation and predisposition to steatotic liver pathology (Table SIV). These findings elucidated the multilevel regulatory consequences of ACE2KO and provided mechanistic insights into associated metabolic dysfunction.
Proteomic analysis of the CK and ACE2KO groups
To evaluate hepatic proteomic alterations following ACE2KO, proteomic analysis was conducted comparing the CK and ACE2KO groups. A total of 191 DEPs [P<0.05; |log2(FC)|>0.263] were identified in the livers of ACE2KO mice, comprising 108 upregulated and 83 downregulated proteins. Volcano plot visualization (Fig. 3A) and a hierarchical clustering heatmap (Fig. 3B) revealed distinct expression patterns between the ACE2KO and CK groups, with prominent clusters highlighting group-specific proteomic signatures (Table SV). GO enrichment analysis (Fig. 3C) revealed that ACE2KO extensively perturbed cellular functions across BPs, CCs and MFs. Specifically, in terms of BPs, activation of interferon-related pathways, including 'cellular response to interferon-β', 'defense response to virus' and 'negative regulation of viral genome replication' indicated compensatory immune activation. The downregulation of proteins associated with intracellular transport, particularly those linked to the 'cytoplasmic vesicle' (such as Rab8a and Flot2), disrupts cellular membrane transport and vesicle dynamics. Similarly, the suppression of proteins involved in lipid metabolism, including those connected to the 'lipid biosynthetic process' (such as Scd1 and Fasn) and those related to the 'mitochondrion' (such as Ass1), impacts the functions of the endoplasmic reticulum membrane and mitochondria. These alterations disrupted intracellular transport and metabolic processes. In terms of CCs, 'cytoplasmic vesicle membrane', 'endoplasmic reticulum membrane' and 'mitochondrion' were suppressed, while 'endoplasmic reticulum' and 'cytosol' were activated, suggesting impaired organelle communication and metabolic homeostasis. In terms of MFs, alterations were observed in 'GTP binding' and 'GTPase activity' alongside enriched 'all-trans-retinyl-palmitate hydrolase, all-trans-retinol forming activity', indicating lipid metabolism disruptions (Table SVI).
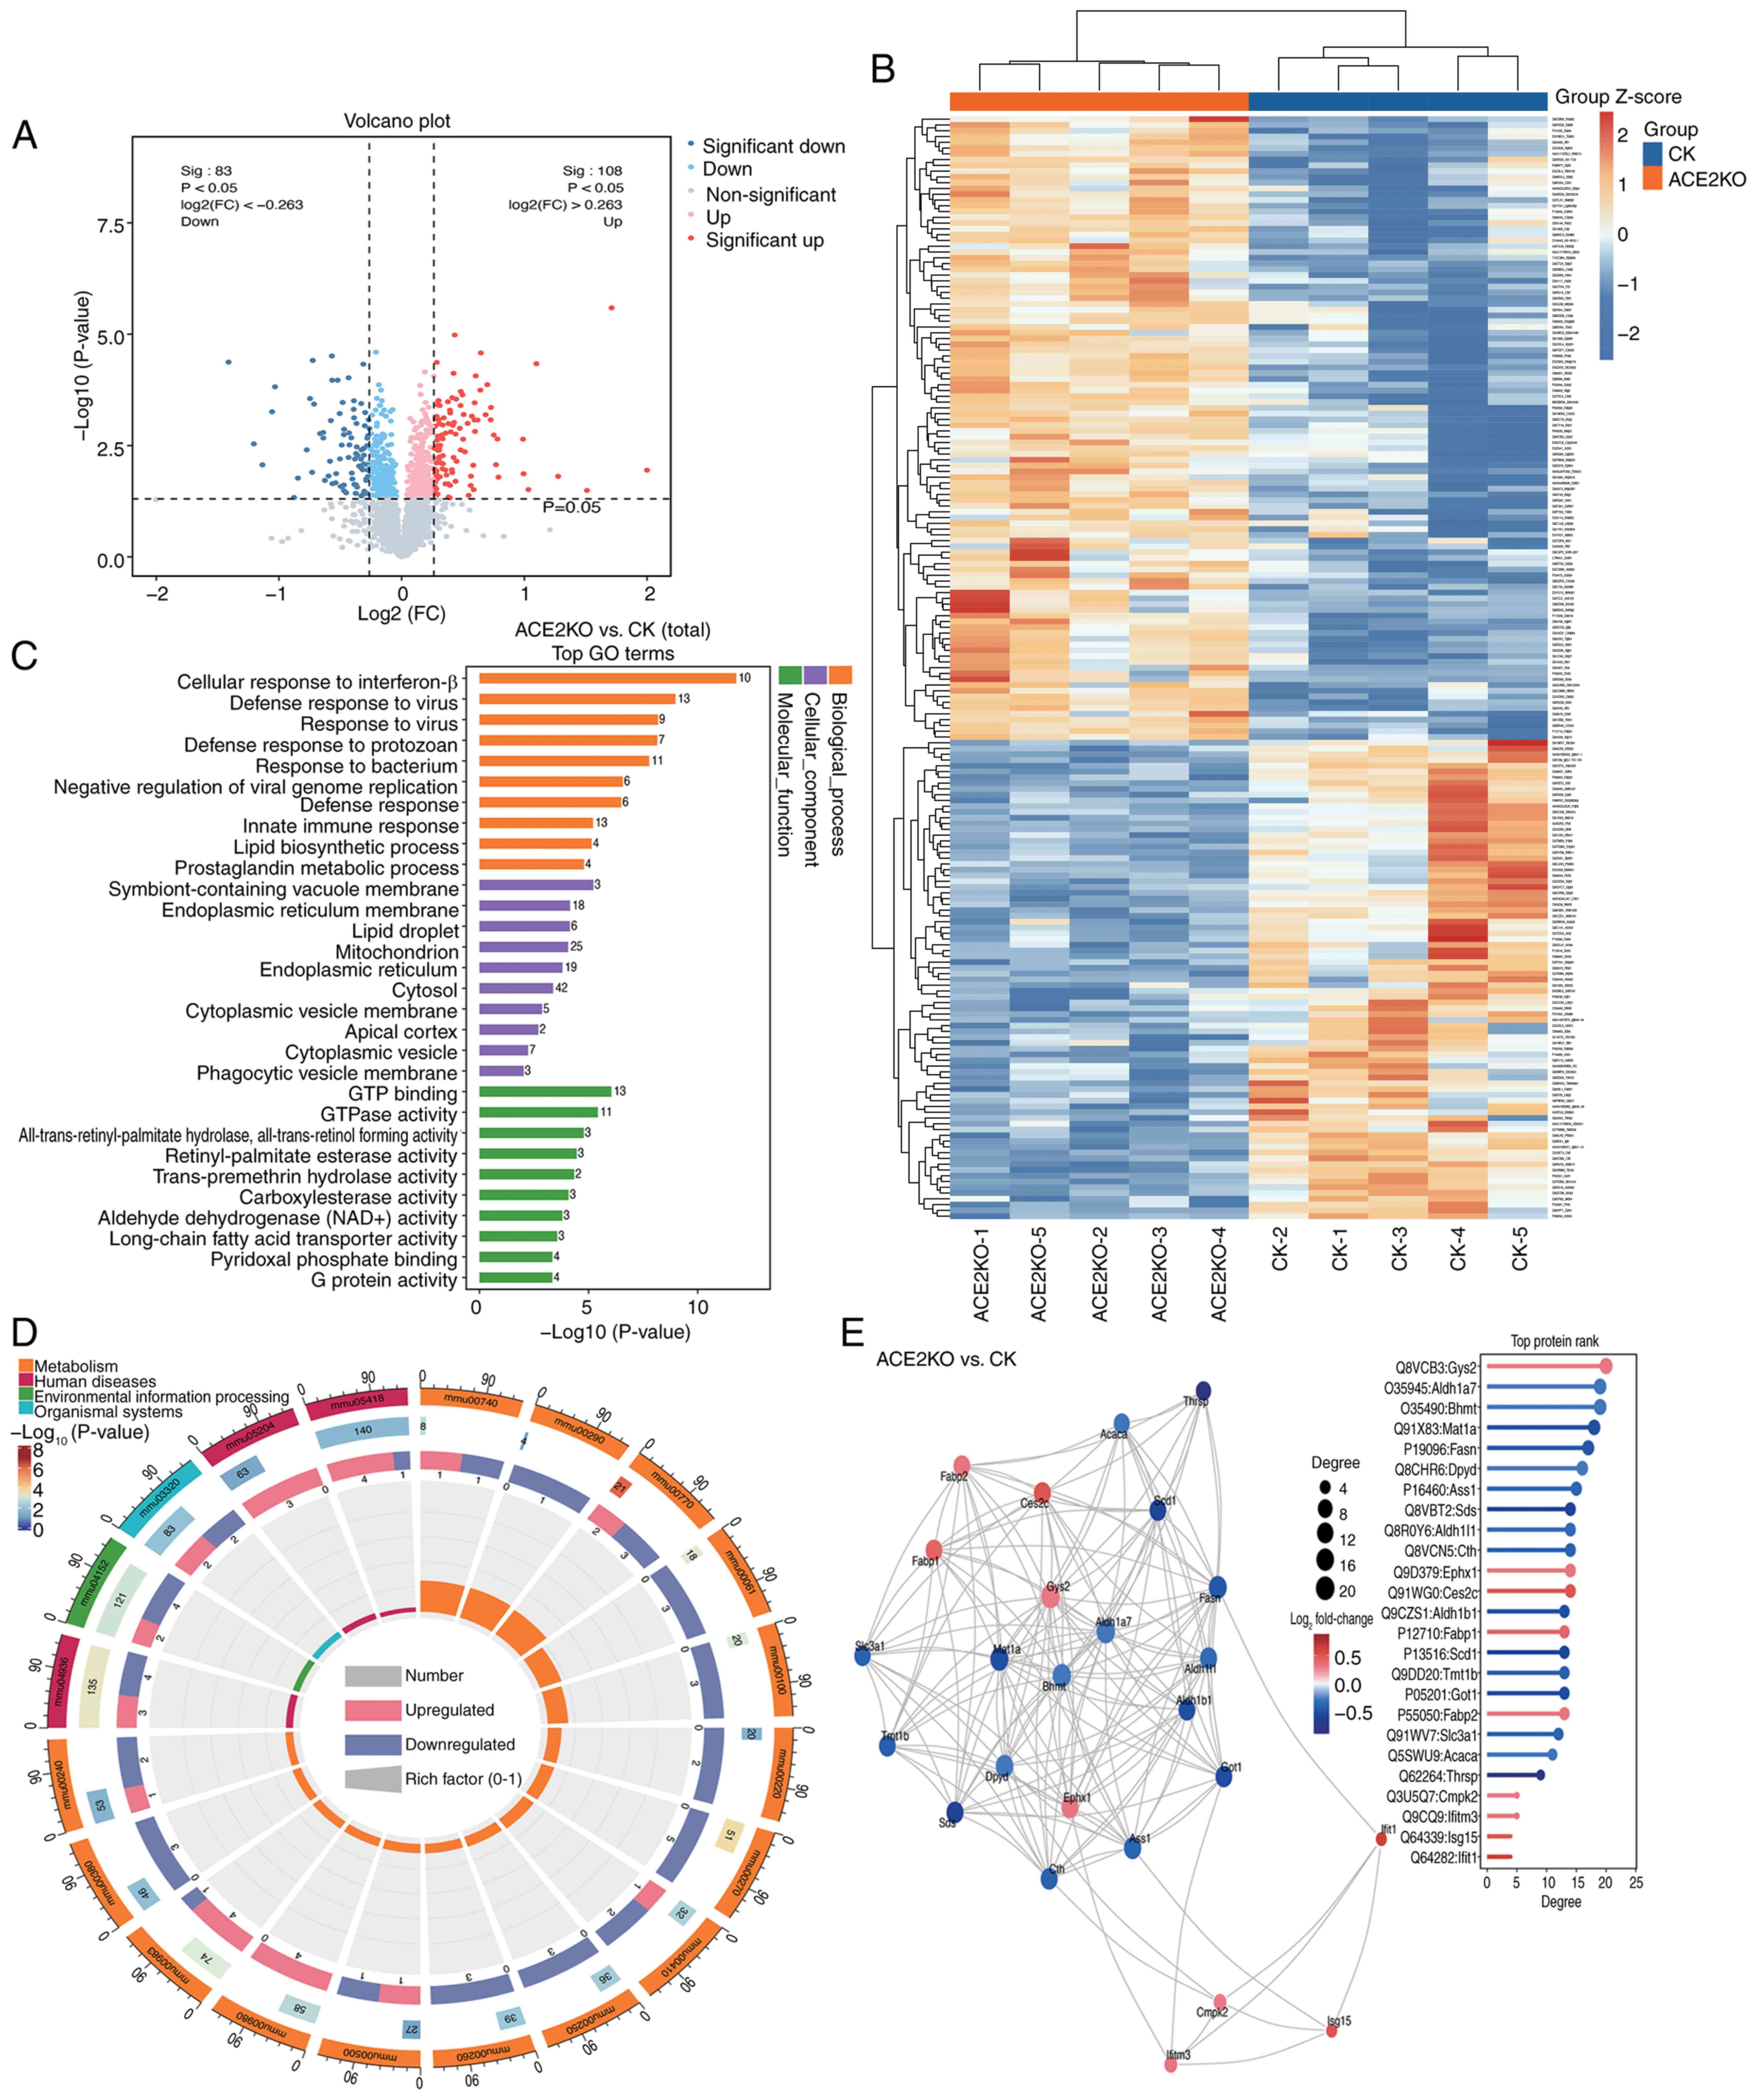
The top 20 pathways with the smallest P-values from the 40 significantly enriched pathways (P<0.05) in Table SVII were selected for visualization in the KEGG analysis (Fig. 3D). Ass1, Got1, Oat and Adss1 were downregulated, and these DEPs were enriched in multiple metabolism-related pathways, such as 'metabolic pathways', 'alanine, aspartate and glutamate metabolism', 'arginine and proline metabolism' and 'pantothenate and CoA biosynthesis'. This indicated that after ACE2 deletion, the liver may experience widespread interference in multiple aspects, including metabolism and antioxidant capacity. Immune-related pathways, including 'Toll-like receptor signaling', 'NOD-like receptor signaling pathway', 'influenza A' and 'hepatitis C', were markedly activated. Concurrently, 'drug metabolism-cytochrome P450' exhibited upregulation of detoxification enzymes (Gsta4 and Gstm7), while 'cystine and methionine metabolism' and 'PPAR signaling pathway' showed coordinated downregulation of core metabolic regulators, highlighting the role of ACE2 in hepatic homeostasis and xenobiotic processing. Protein-protein interaction network analysis of the top 25 DEPs by degree centrality (Fig. 3E) identified key functional nodes. Fasn, a key enzyme in lipid metabolism (31), was among the proteins with a high degree value. Mat1a, highly expressed in normal liver tissue, serves a crucial role in maintaining hepatic function (32). Aldh1b1 is involved in aldehyde detoxification (33). Notably, some proteins with high degree values, such as Ttc36, Iigp1 and Igtp, were not displayed in Fig. 3E, yet they serve significant roles. For instance, Ttc36, a tetratricopeptide repeat-containing protein, acts as an HSP70 cochaperone and is implicated in protein-protein interactions, cell cycle regulation and tumor suppression in hepatocellular carcinoma (34). Similarly, Iigp1 (35) and Igtp (36) are involved in immune responses and interferon signaling (Table SVIII). These findings delineated ACE2KO-induced proteomic rewiring, linking disrupted lipid metabolism, redox imbalance and immune dysregulation to hepatic pathophysiology.
Metabolomic analysis of the CK and ACE2KO groups
The metabolomic analysis further validated these findings. OPLS-DA (Fig. 4A) demonstrated tight intra-group clustering, and distinct separation between the ACE2KO and CK groups. Model validation via 200 permutation tests yielded R2 values approaching 1.0, confirming robust stability and predictive reliability (Fig. 4B). Using VIP >1 and P<0.05, 193 differentially expressed metabolites (DEMs) were identified, annotated using the KEGG, HMDB, LipidMaps and METLIN databases, and categorized into 119 upregulated and 74 downregulated metabolites based on the log2(FC) >0 or <0 (Table SIX). The volcano plot visualization (Fig. 4C) delineated the DEM distribution. The hierarchical clustering heatmap (Fig. 4D) highlights the distinct metabolic clusters between the ACE2KO and CK groups, in which red indicates high-expression and blue indicates low-expression metabolites, reflecting significant differences in metabolic levels between the two groups. Correlation analysis of the top 20 VIP-ranked DEMs (Fig. 4E) helped assess the relationships among them, offering deeper insights into their interactions during biological state changes. For example, correlation analysis identified a strong positive correlation between taurodeoxycholic acid and tauro-α-muricholic acid. This may stem from their similar roles in bile acid metabolism (37,38). As tauro-conjugated bile acids, their synthesis and transformation involve similar enzymes and intermediates, likely causing their coordinated concentration changes. Conversely, α-d-glucose and d-glutamine exhibited a significant negative correlation, which might have affected the metabolic regulation of hepatocytes and prompted cellular trade-offs in glucose and glutamine utilization to meet metabolic demands following ACE2 deletion. Furthermore, the correlation analysis identified other complex correlation patterns. Glycerophosphocholine was positively correlated with 3-amino-3-methylbutanoic acid (r=0.847) and O-propanoyl-carnitine (r=0.863). Additionally, 3-amino-3-methylbutanoic acid and O-propanoyl-carnitine exhibited a high correlation (r=0.999). These correlations suggested that phospholipid and amino acid metabolic pathways were subject to coordinated regulation. The concentration changes of these two types of metabolites in the metabolic regulatory network may be influenced by common regulatory factors, thereby helping to preserve cellular metabolic homeostasis (Table SX).
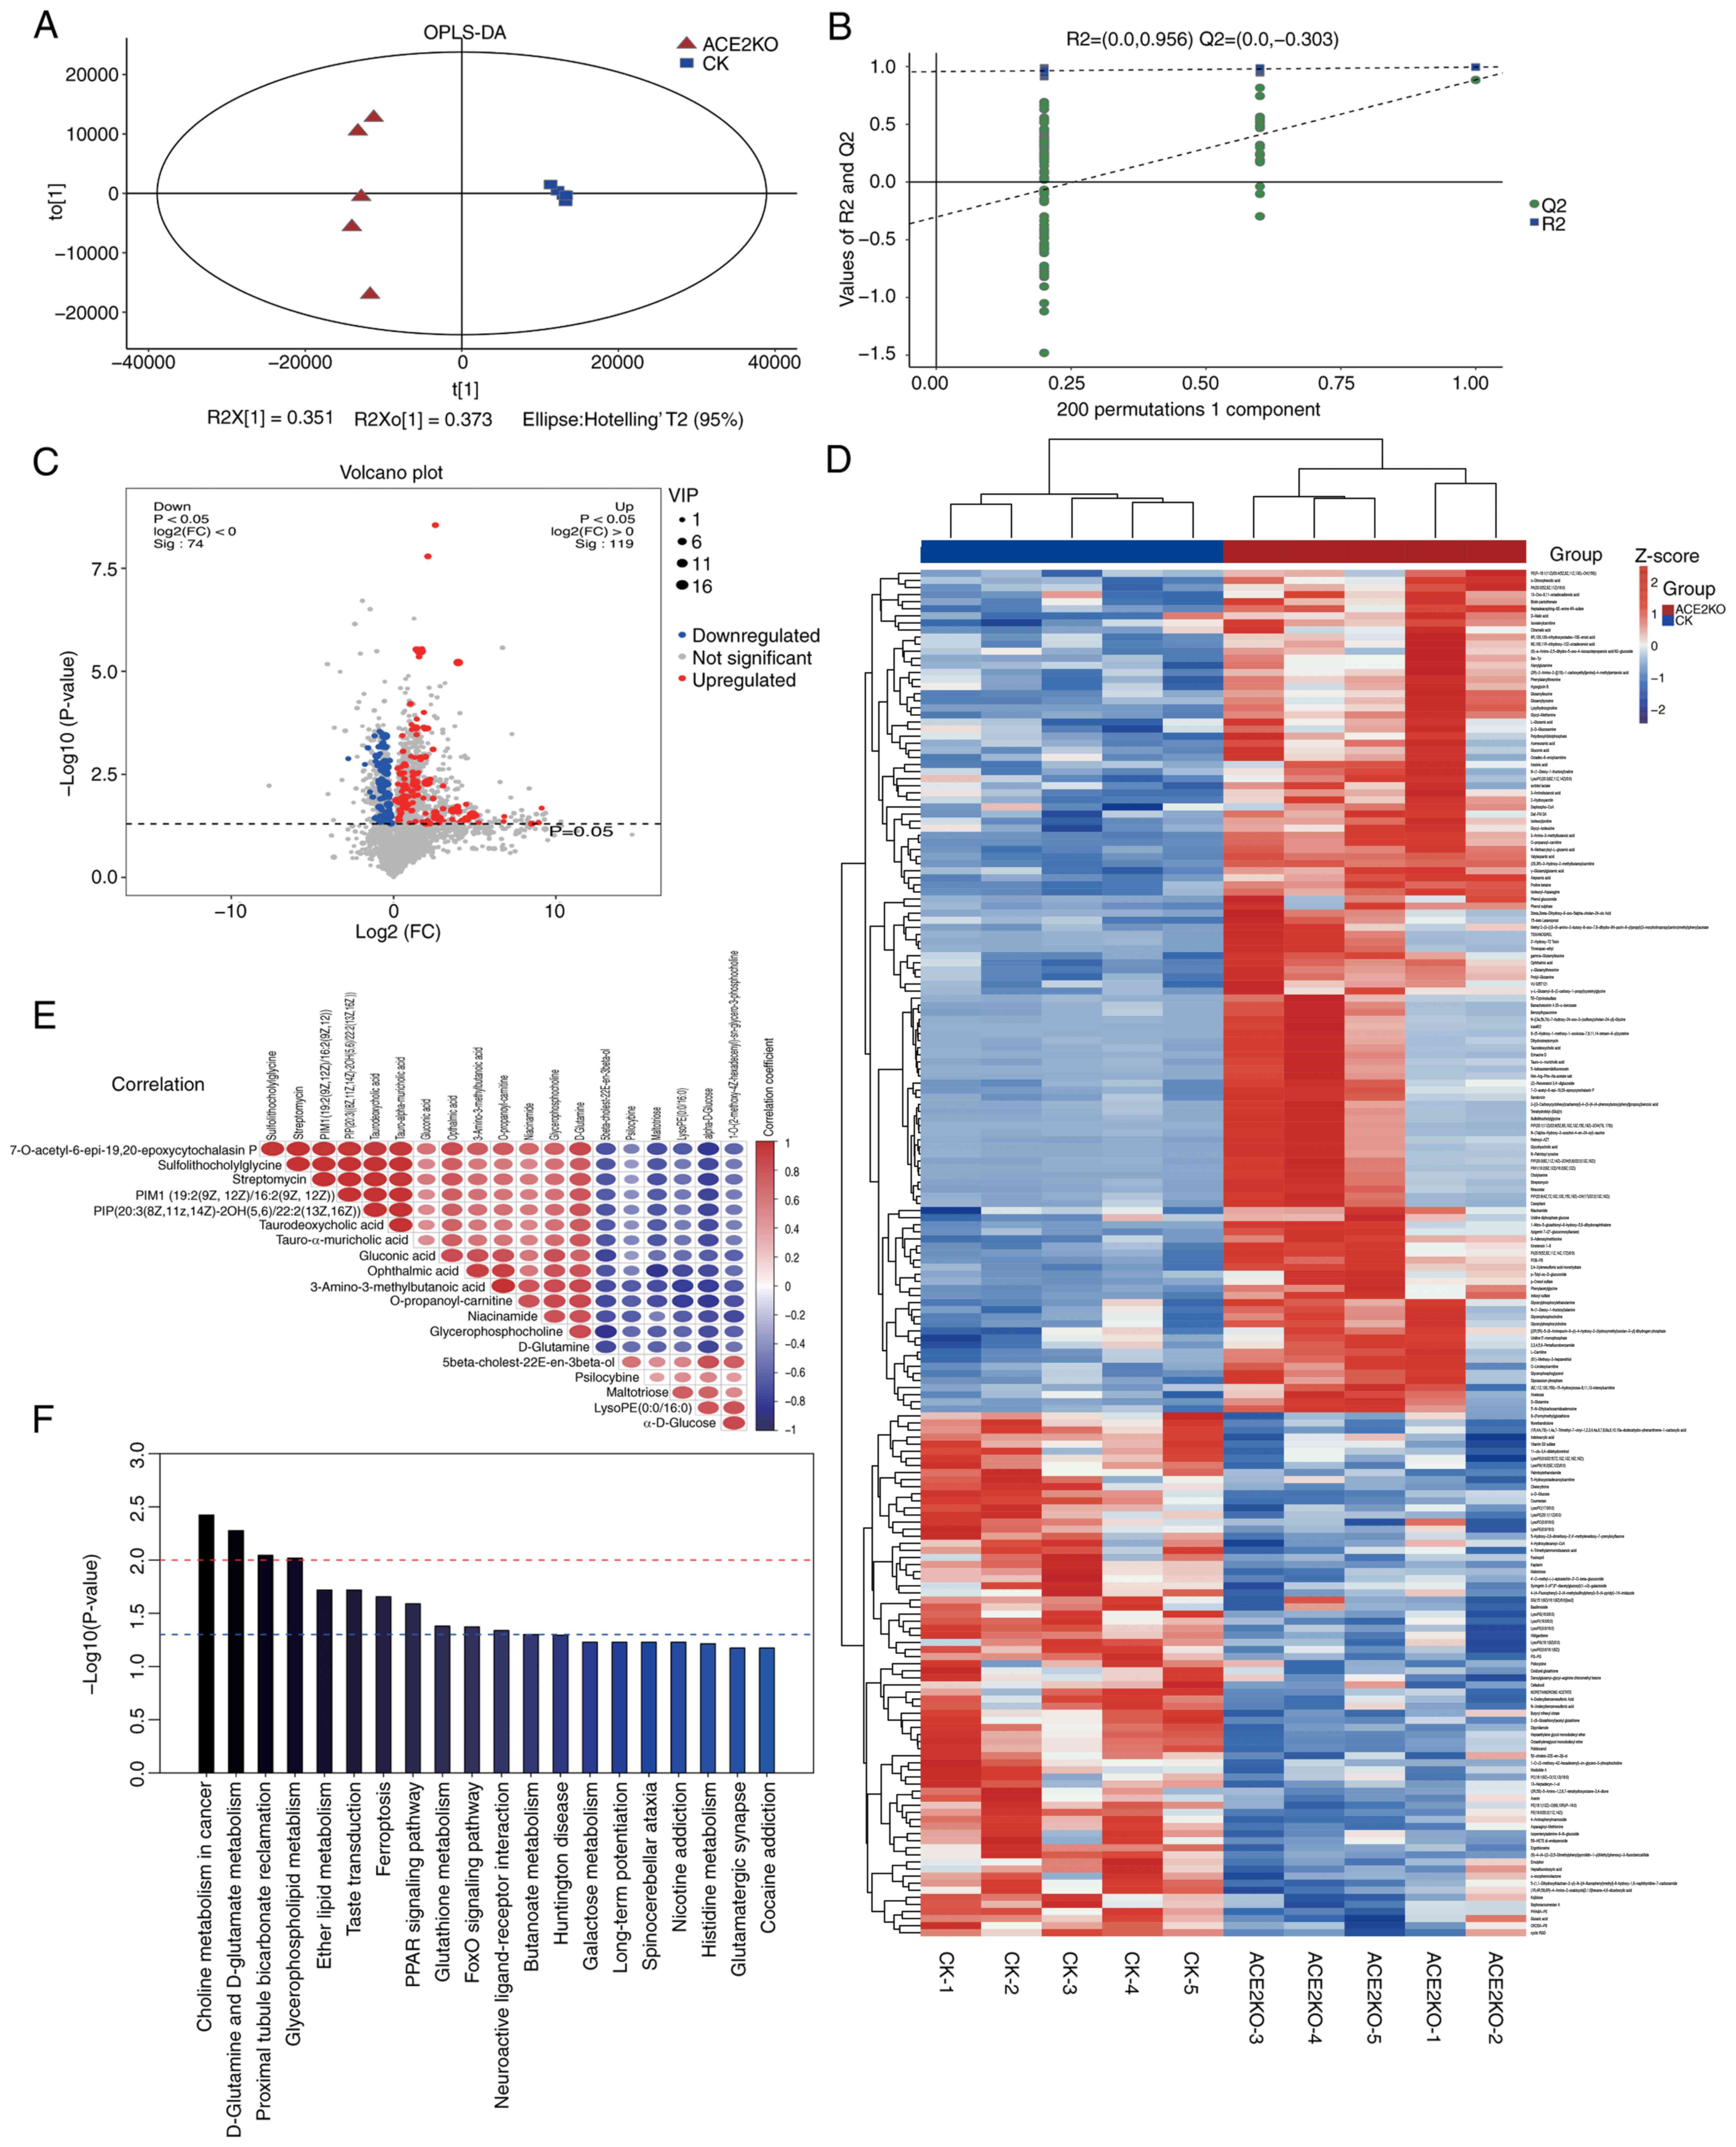
The KEGG enrichment analysis (Fig. 4F) highlighted the involvement of DEMs in lipid metabolism, inflammation, oxidative stress, energy metabolism and xenobiotic detoxification. Lipid-related pathways ('glycerophospholipid metabolism' and 'ether lipid metabolism') exhibited marked enrichment, with upregulated glycerophosphocholine and glycerophosphoethanolamine indicating enhanced lipid synthesis, while reduced LysoPC(17:0/0:0) suggested membrane lipid dyshomeostasis. In terms of oxidative stress pathways, decreased oxidized glutathione (GSSG) and elevated L-glutamic acid levels in 'glutathione metabolism' implied metabolic rebalancing of redox defenses. 'PPAR signaling' exhibited slight upregulation of α-dimorphecolic acid, potentially modulating lipid-driven anti-inflammatory responses. Energy metabolism pathways ('D-glutamine and D-glutamate metabolism') showed elevated L-glutamic acid and D-glutamine levels, indicating heightened glutamatergic activity, whereas downregulated α-D-glucose in the 'glycolysis/gluconeogenesis' pathway may indicate a reprogramming of hepatic energy metabolism. Xenobiotic detoxification pathways ('metabolism of xenobiotics by cytochrome P450') displayed upregulated 1-nitro-5-glutathionyl-6-hydroxy-5,6-dihydronaphthalene, and downregulated 2-(S-glutathionyl)acetyl glutathione and S-(formylmethyl) glutathione levels, reflecting a glutathione system imbalance and oxidative stress exacerbation. Additionally, glycerophosphocholine upregulation ('choline metabolism') and GSSG downregulation ('ferroptosis') indicated an interaction between lipid dysregulation and oxidative injury, potentially driving steatosis and NAFLD progression (Table SXI).
Integrated multi-omics analysis of the transcriptome, proteome and metabolome
The present study employed mixOmics to integrate three omics datasets, demonstrating that transcriptomic, proteomic and metabolomic profiles distinguished the ACE2KO group from the CK group along the first principal component (PC1). Strong positive correlations among PC1 scores across omics layers (Fig. 5A) indicated synchronized alterations in gene expression, protein abundance and metabolic homeostasis following ACE2KO, suggesting that ACE2 is a pivotal regulator of cross-scale BPs. Random forest analysis identified the top 30 discriminative biomarkers (RNA/protein/metabolite) based on importance scores (Fig. 5B). Prdm4 exhibited the highest importance value (0.02; P=1.78×10⁻⁷), suggesting its potential role as a master regulator of the ACE2KO phenotype (Table SXII). Cross-omics correlation analysis paired gene-protein relationships from transcriptomic and proteomic datasets with metabolomic features (Fig. 5C). The RNA-metabolite correlation distribution was bimodal, with negative correlations peaking between -0.8 and -0.6, and positive correlations between 0.6 and 0.8. Similarly, the protein-metabolite correlation distribution was also bimodal, with negative correlations peaking between -0.6 and -0.4, and positive correlations peaking between 0.4 and 0.6. Notably, RNA-metabolite correlations exhibited a broader dispersion in extreme ranges than their protein-metabolite counterparts, implying a greater transcriptional regulatory amplitude. Table SXIII provides comprehensive correlation matrices, with the Fabp1-(2S,3R)-3-hydroxy-2-methylbutanoylcarnitine association serving as a representative example. Fabp1, a fatty acid-binding protein, serves a key role in lipid metabolism by facilitating the transport of long-chain fatty acids and other hydrophobic molecules (39). In the present study, a significant positive correlation was observed between Fabp1 mRNA expression and the abundance of this metabolite at the transcriptional level. However, at the proteomic level, the correlation between Fabp1 protein levels and the metabolite did not reach the conventional significance threshold after multiple testing correction (adjusted P-value=0.076), although the raw P-value was low (0.000166), indicating a strong initial association. Considering the established function of Fabp1, it is plausible that Fabp1 regulates metabolic pathways through dual mechanisms: By influencing gene expression and by directly binding to or transporting metabolites, thereby affecting their dynamic balance (39). These findings collectively suggest a potential biological link between Fabp1 and the metabolite. Further research is necessary to elucidate the specific role and mechanism of Fabp1 in lipid metabolism, which could identify novel targets for the treatment of metabolic diseases.
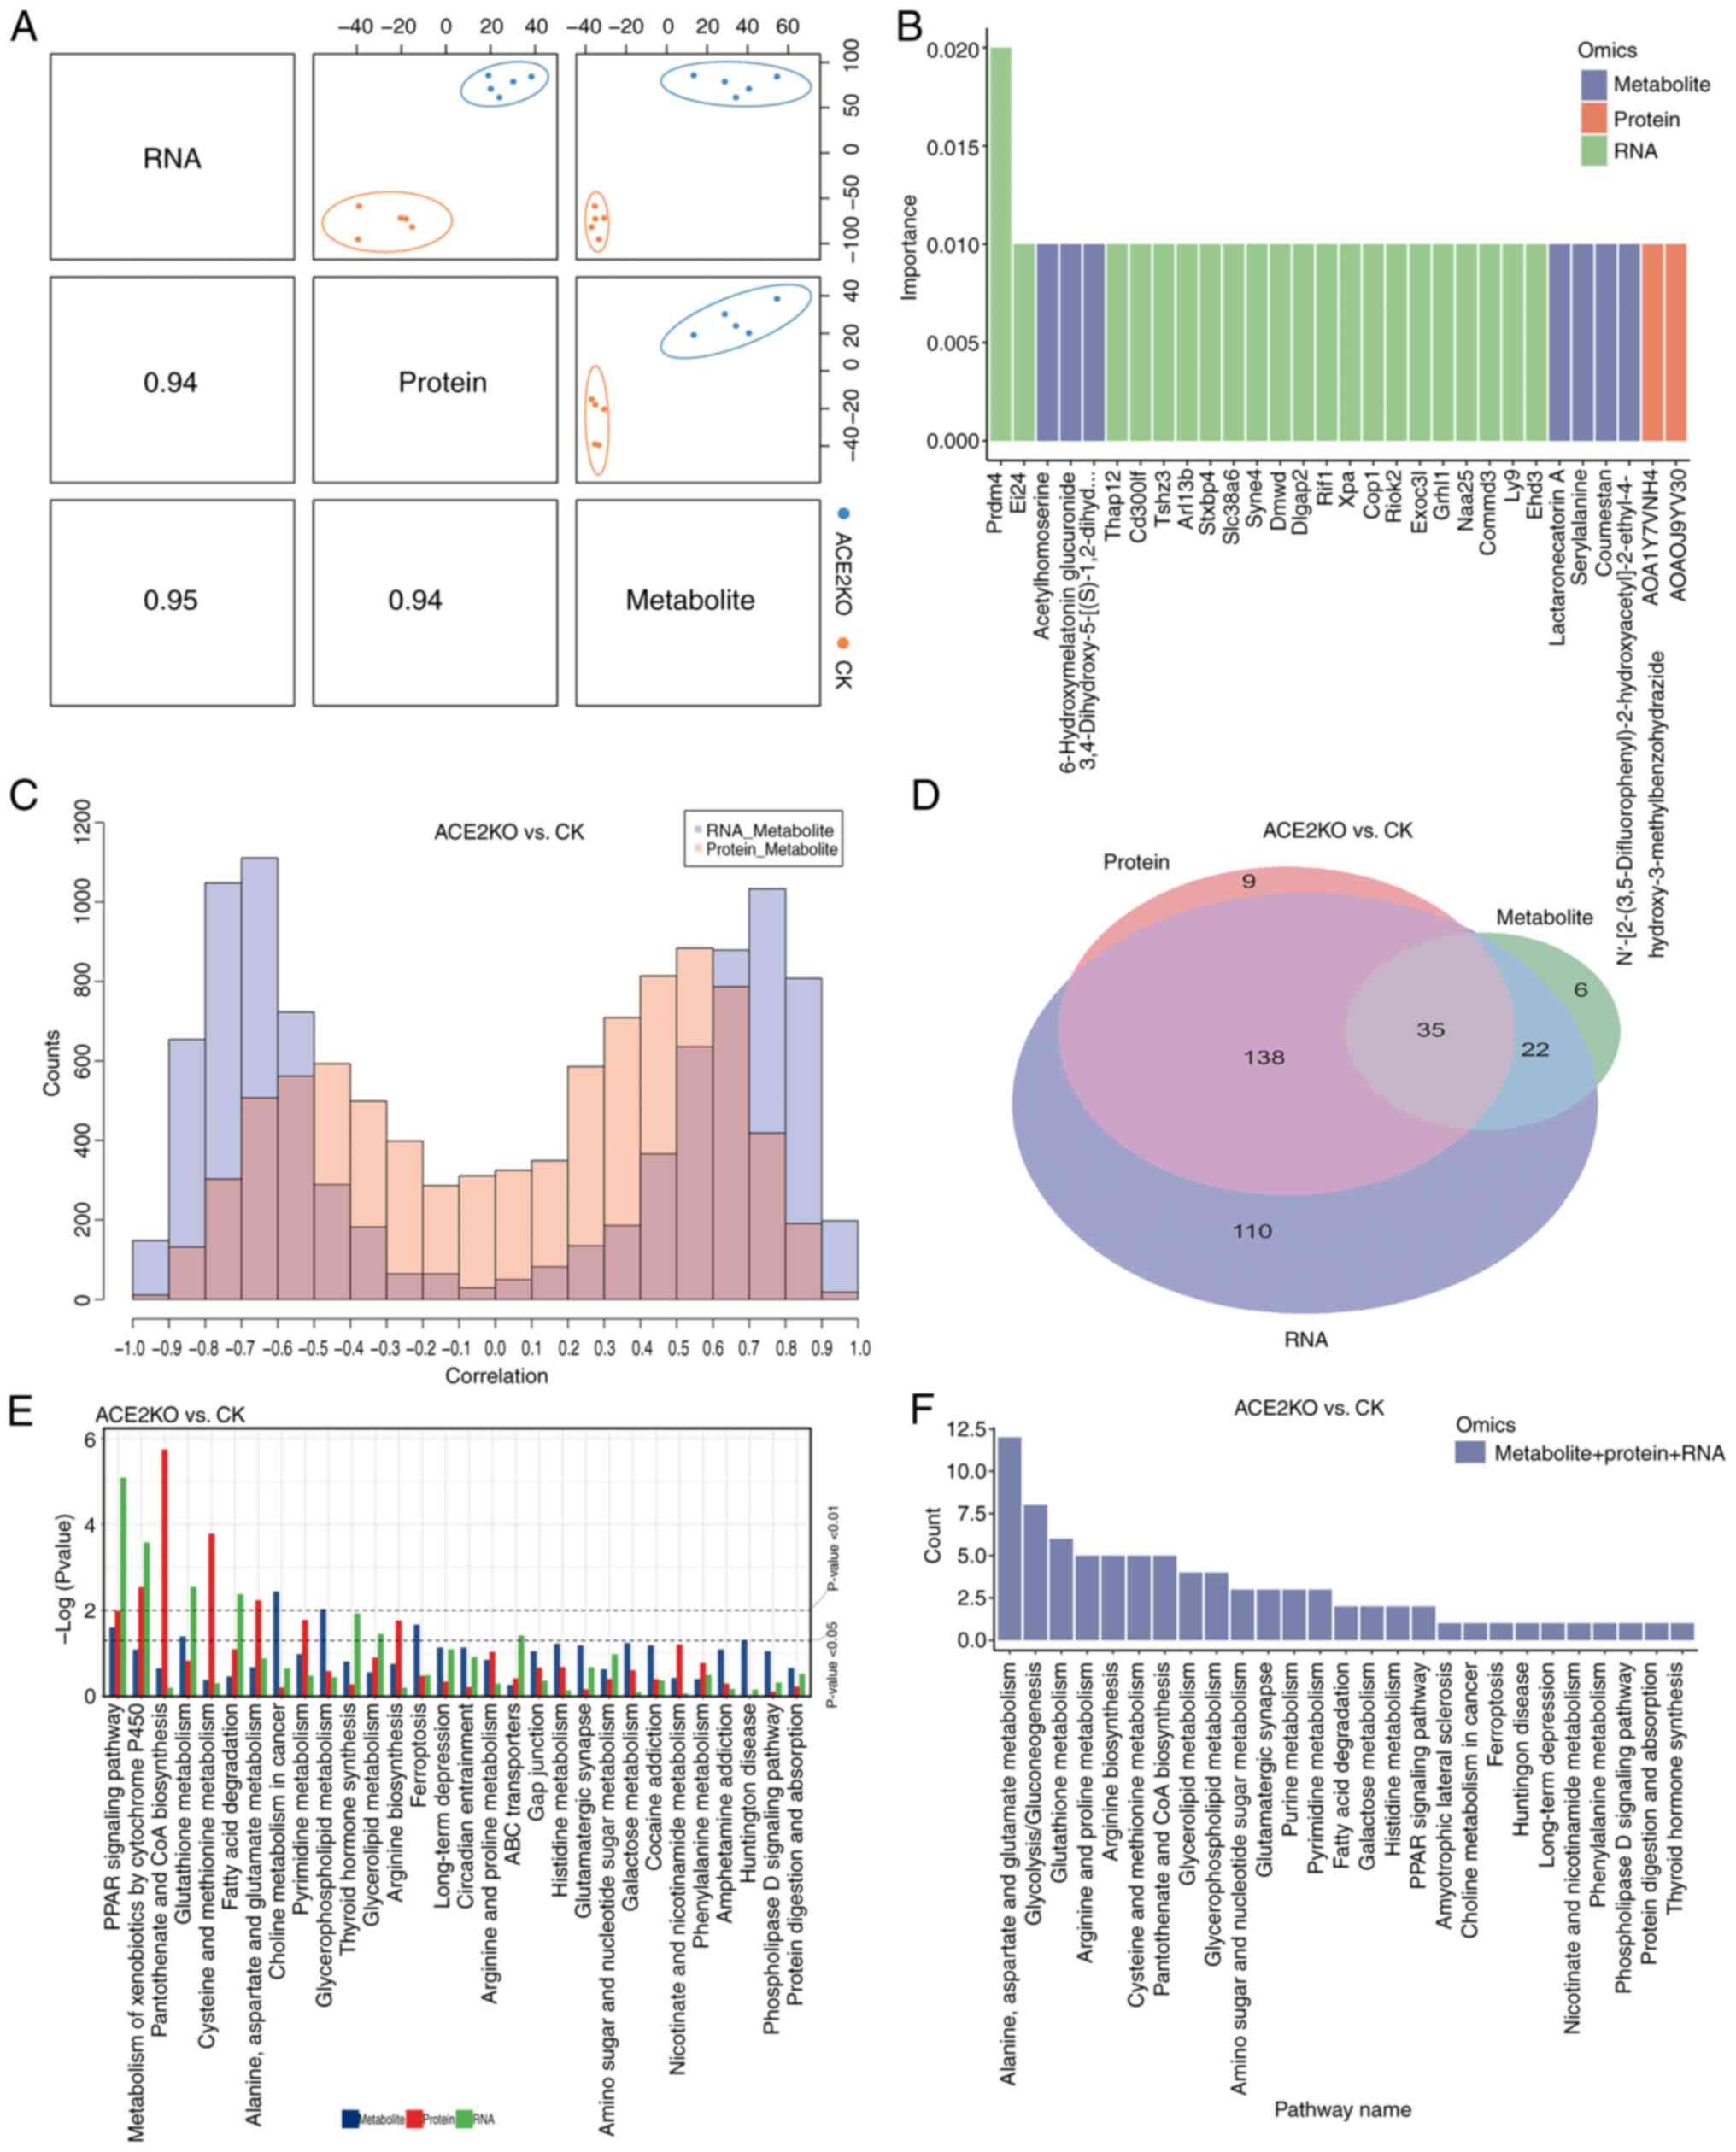
Integrated analysis of the pathways enriched by DEGs, DEPs and DEMs was performed using Venn diagram construction (Fig. 5D), which identified 35 overlapping pathways (Table SXIV). Pathway prioritization involved ranking pathways based on the aggregated P-values from KEGG enrichment analyses across the transcriptomic, metabolomic and proteomic datasets, with the top 30 pathways exhibiting the lowest combined P-values selected for comparative evaluation (Fig. 5E). The 'PPAR signaling pathway' emerged as the most significant cross-omics pathway, demonstrating substantial enrichment across all three molecular layers. Notably, the 'metabolism of xenobiotics by cytochrome P450' pathway showed pronounced enrichment in both transcriptional and proteomic profiles, suggesting that the activation of drug-metabolizing genes and proteins may contribute to toxicological responses by indirectly modulating metabolite accumulation.
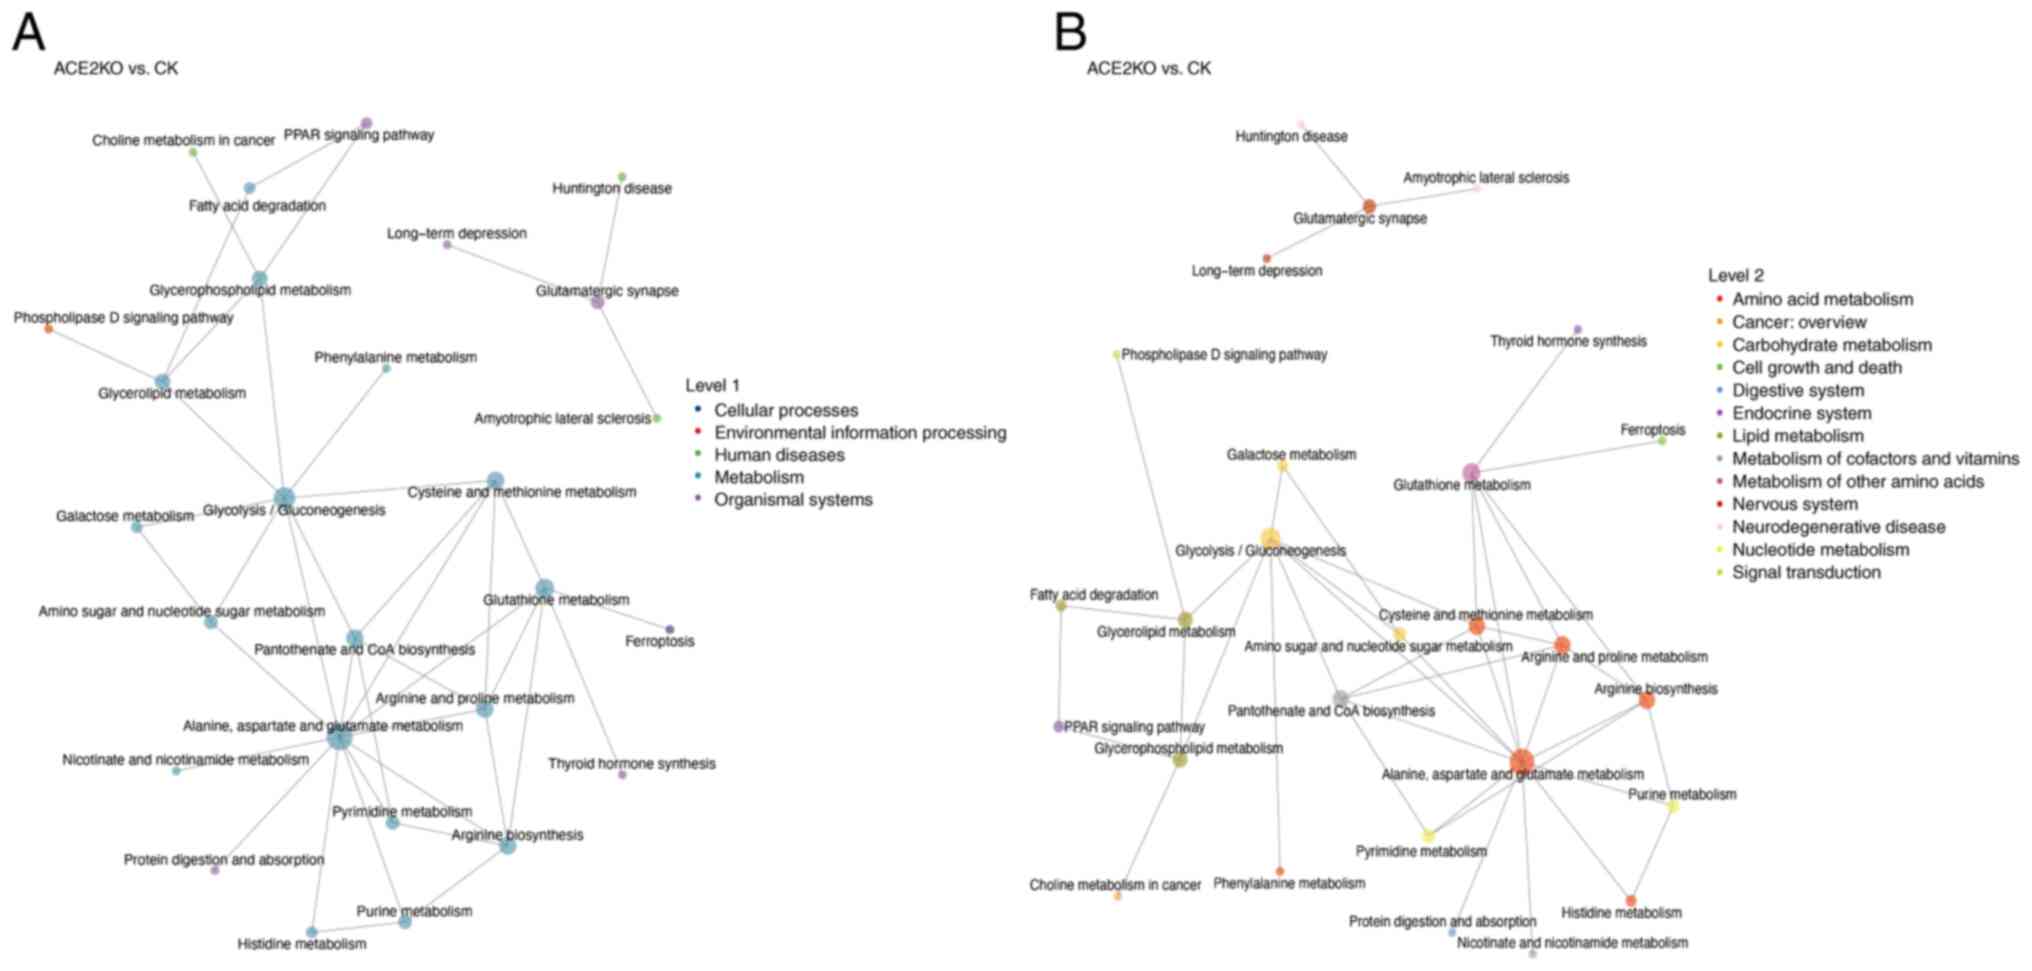
KGML-based network analysis of upstream and downstream pathway interactions revealed that a set of highly connected pathways serve as central nodes in the metabolic network (Fig. 5F). The hub pathways included amino acid metabolism (such as 'alanine, aspartate and glutamate metabolism' with 12 upstream/downstream connections) and lipid metabolism ('glycerolipid metabolism' and 'glycerophospholipid metabolism') pathways, which regulate energy metabolism, biosynthesis and redox balance (40). 'Glycolysis/gluconeogenesis' demonstrated extensive cross-talk with lipid and amino acid metabolism, suggesting a key role in energy allocation (41). The 'PPAR signaling pathway' and 'phospholipase D signaling pathway', by regulating fatty acid degradation and glycerophospholipid metabolism, integrate metabolic flux with cellular functional responses to maintain energy homeostasis (42). Fig. 6A categorizes these pathways into biological classes, revealing that amino acid and lipid metabolism pathways form the network core through high connectivity (such as 'alanine, aspartate and glutamate metabolism' with 12 connections), integrating 'glycolysis/gluconeogenesis', 'glutathione metabolism' and 'purine metabolism'. In Fig. 6B, the functional associations are further detailed. For example, 'alanine, aspartate and glutamate metabolism' interacts widely with 'purine metabolism', 'pyrimidine metabolism' and 'histidine metabolism'. This indicates the complexity and interconnection of hepatic metabolic pathway dysregulation after ACE2 deletion, including the urea cycle, antioxidant systems and lipid metabolism, which are crucial for maintaining liver homeostasis (43-45). 'Glycolysis/gluconeogenesis' is closely connected to amino acid metabolism, lipid metabolism and nucleotide metabolism (46,47). This interaction indicates that after ACE2KO, hepatic energy metabolism undergoes global adjustments to adapt to oxidative stress or energy deficiency. Table SXV lists the hepatic energy metabolic adjustments after ACE2KO, including detailed information on metabolic pathway changes.
Discussion
In the present study, an ACE2KO murine model was used to investigate the role of ACE2 in hepatic homeostasis. As a key negative regulator of the RAS equilibrium, ACE2 deletion disrupts the balance between AngII and Ang-(1-7), driving multifaceted pathological cascades (48). AngII has been shown to activate AT1Rs, inducing mitochondrial dysfunction and oxidative stress in hepatocytes through the downregulation of antioxidant enzymes (SOD2 and GPx1) and elevated pro-inflammatory mediators (TNF-α, monocyte chemoattractant protein 1 and IL-8) (21), and these effects may negatively impact cell membrane sodium/water retention and the development of pathological changes such as cytoplasmic vacuolization and hepatocyte edema. Chronic AngII elevation sustains hepatic inflammation, promotes lymphocyte infiltration into the parenchyma and accelerates NAFLD-to-non-alcoholic steatohepatitis (NASH) progression (21). As a central metabolic organ of the human body, the liver has a highly developed blood perfusion system. When hepatic microcirculation is disturbed, it can trigger tissue hypoxia and metabolic disorders, thereby promoting the occurrence, development, and deterioration of liver diseases (49). Studies have shown that the angiotensin system has a dual role in regulating hepatic microcirculation (50,51). On one hand, elevated AngII activates hepatic sinusoidal endothelial cell contraction via AT1Rs, while an impaired Ang-(1-7)/Mas axis reduces NO-mediated vasodilation, exacerbating blood flow stasis and tissue hypoxia. This hemodynamic disturbance is associated with hepatic sinusoidal congestion and contributes to hypertension under chronic stimulation (52). In the present study, ACE2KO was found to significantly increase TC and TG levels and induce hepatocyte vacuolar degeneration. In patients with NAFLD, the RAS undergoes significant alterations (53). Specifically, the classic arm of the hepatic RAS, which comprises AngII and AT1R, is pathologically over-activated. This over-activation of AngII and AT1R is closely associated with hepatic lipid accumulation, increased markers of insulin resistance and elevated oxidative stress (54). AngII binding to AT1R triggers the activation of NADPH oxidase, leading to excessive production of reactive oxygen species (ROS). The surge in ROS subsequently inhibits the phosphorylation of key molecules in the insulin signaling cascade. This inhibition reduces the insulin sensitivity of hepatocytes, thereby exacerbating dyslipidemia and metabolic disorders (55). Collectively, these events form a vicious cycle that drives the progression of NAFLD and contributes to the development of metabolic syndrome. Gao et al (23) demonstrated that ACE2/Ang-(1-7)/Mas activation reduced hepatic steatosis, enhanced insulin sensitivity via PI3K/AKT pathway activation and suppressed gluconeogenesis/inflammation, highlighting its therapeutic potential in restoring metabolic homeostasis.
To elucidate the complex interplay between hepatic pathology and metabolic dysregulation, transcriptomic, proteomic and metabolomic analyses were conducted in the present study to assess the effects of ACE2KO on hepatic gene expression, protein dynamics and metabolic networks. Transcriptomic analysis revealed that the DEGs were enriched in lipid metabolism, xenobiotic detoxification, circadian rhythm disruption and energy imbalance. Upregulation of PPAR signaling pathway genes (Acsbg1, Fabp1 and Plin1) coupled with downregulation of lipid synthesis genes (Scd1 and Acsl4) indicated enhanced PPARγ-dependent lipid uptake and storage, and suppressed de novo fatty acid synthesis in ACE2KO mice, potentially driving oxidative stress and lipotoxicity through chronic lipid accumulation. Elevated expression of detoxification-related genes (Cbr1 and Gstm1) in the cytochrome P450-mediated xenobiotic metabolism pathway may indicate a potential compensatory response of the liver to ACE2 deletion, suggesting an attempt to alleviate metabolic disturbances. Proteomic analysis identified 191 DEPs, with marked upregulation of antiviral defense proteins (Oas1a, Rsad2 and Bst2) in interferon-β response pathways, implying that ACE2KO-induced compensatory interferon signaling may exacerbate chronic inflammation. Concurrent suppression of lipid synthesis enzymes (Scd and Fasn) and membrane dynamics regulators (Rab8a and Flot2) reflected endoplasmic reticulum-mitochondrial dysfunction, amplifying metabolic stress. Notably, a previous study has reported SARS-CoV-2 spike protein-induced upregulation of mitochondrial translation proteins (TFR2 and NGAL) and antiviral effectors (OAS1 and BST2) via ACE2 binding, which is consistent with the present findings regarding interferon-driven metabolic reprogramming in liver injury (56). Metabolomics analysis indicated upregulated phenylacetylglycine in the phenylalanine metabolism pathway. As a gut microbiota metabolite, phenylacetylglicine can interact with adrenergic receptors, increasing the cardiovascular disease risk (57). Its elevated levels may also exacerbate metabolic disorders and insulin resistance by activating inflammatory signaling pathways, suggesting a potential link between ACE2 deletion and metabolic diseases (25). Otherwise, ACE2KO mice showed upregulated α-dimorphecolic acid in the PPAR signaling pathway of the liver. As α-dimorphecolic acid can activate PPARγ, which serves a key role in fatty acid metabolism and glucose homeostasis (57,58), this upregulation may enhance PPARγ-mediated effects on hepatic lipid metabolism. Meanwhile, alterations were observed in the expression of metabolites associated with glutathione metabolism, with L-glutamic acid being upregulated and GSSG being downregulated. Since glutathione metabolism is crucial for maintaining redox homeostasis (59), such an imbalance indicates that ACE2 deletion could potentially disrupt the redox equilibrium by modulating glutamine metabolism, a hypothesis supported by a previous study (60). Zhao et al (25) corroborated that ACE2 deletion disrupted hepatic amino acid homeostasis, metabolic hub functions and steroid balance, which is consistent with the present metabolomic data. Cross-omics integration was performed to systematically decode the hierarchical regulatory mechanisms underlying the ACE2KO-induced hepatic metabolic dysfunction.
Lipid metabolic derangements and aberrant inflammation promote hepatic fatty acid accumulation, initiating NAFLD progression to NASH characterized by hepatocyte injury and inflammatory infiltration (61). Sustained inflammation activates HSCs, inducing collagen deposition and fibrosis, with potential progression to cirrhosis (62). Transcriptomic profiling revealed marked PPAR pathway activation in ACE2KO mice. PPAR isoforms (α, β/δ and γ) regulate fatty acid metabolism and anti-inflammatory responses through tissue-specific expression: PPARα governs hepatic fatty acid oxidation, PPARβ/δ modulates lipid uptake and oxidation to alleviate insulin resistance and steatosis, and PPARγ promotes adipocyte differentiation and lipid storage (63-65). Previous research has indicated that α-dimorphecolic acid was significantly elevated in patients with NASH with hepatic steatosis, which was associated with lipid metabolism dysregulation (66). Further research has shown that in a high fat diet-induced NAFLD model, the abnormal accumulation of α-dimorphecolic acid may disrupt fatty acid oxidation and inflammatory signaling pathways, thereby exacerbating hepatic lipid metabolic dysfunction (67), which is consistent with the present findings.
Transcriptomic analysis following ACE2 deletion revealed downregulation of the PPAR signaling core gene, Acsl4, and upregulation of Acsbg1, Plin1, Cpt1b, Cpt1c and Fabp1. Proteomic analysis confirmed reduced ACSL4 protein levels and elevated FABP1 levels, whereas metabolomics revealed increased α-dimorphecolic acid levels. Notably, in ACE2KO mice, Plin1, Cpt1b and Cpt1c mRNA expression was upregulated but no significant protein level changes were observed. This mRNA-protein discordance may result from post-transcriptional regulation, indicating the complexity of gene expression. However, these genes and proteins remain critical for fatty acid transport, activation and storage (68-70). ACSL4 catalyzes the conversion of fatty acids to acyl-CoA esters, which is the rate-limiting step in lipid biosynthesis. Reduced Acsl4 mRNA expression may drive its protein downregulation, disrupts lipid homeostasis and contributes to its pathogenesis. The hypomethylation of ACSL4 in patients with NASH underscores its therapeutic relevance (71). Fabp1, which serves a key role in lipid metabolism, can bind and transport fatty acids, thereby regulating their metabolism and distribution. The increase in both mRNA and protein expression of Fabp1 in the present study may indicate that cells upregulate Fabp1 to manage lipid metabolic changes and maintain lipid homeostasis in the context of ACE2 deletion (72). A previous study has corroborated that ACE2 deletion-induced imbalance between Ang-(1-7) and AngII impaired lipid oxidation and redox regulation, accelerating steatohepatitis (73).
Integrated multi-omics analysis systematically elucidated the regulatory mechanisms by which ACE2 deletion perturbed hepatic detoxification and the oxidative stress balance. Transcriptomic data revealed significant enrichment of arachidonic acid metabolism, characterized by upregulated expression of Cyp4a10 and Cyp4a14. As key enzymes in lipid metabolism, members of the CYP4A subfamily enhance fatty acid oxidation to mitigate the metabolic overload. However, this compensatory response concurrently increases ROS production, thereby creating a paradoxical interplay between detoxification and oxidative stress (74). The present study revealed that in the transcriptome, the transcription levels of the glutathione S-transferase (GST) genes Gstm1 and Gstm3 were elevated and correspondingly in the proteome the protein abundances of Gstm1 and Gstm3 also increased, which further supported the compensatory activation of detoxification functions. GST family members, including Gsta2, Gstm1-4, Gstp3, Gstt2 and Mgst3, mediate detoxification by neutralizing harmful substances, repair DNA damage, maintain cellular integrity and counteract oxidative stress (75). Mechanistically, GSTs catalyze the conjugation of reduced glutathione to endogenous and exogenous electrophilic compounds, converting them into water-soluble forms for excretion. This process is critical for eliminating toxins (such as drugs, pesticides and environmental pollutants), demonstrating the dual role of GSTs in detoxification and cytoprotection (76).
Intracellular glutathione exists primarily in two forms, glutathione and GSSG, forming a redox couple essential for maintaining the oxidative balance and supporting detoxification (77). Metabolomic profiling revealed elevated levels of 1-nitro-5-glutathionyl-6-hydroxy-5,6-dihydronaphthalene, and reduced levels of 2-(S-glutathionyl) acetyl glutathione, S-(formylmethyl) glutathione and GSSG in ACE2KO livers. This imbalance reflects excessive glutathione consumption during detoxification, leading to a compromised antioxidant capacity. Metabolic redistribution may imply that under persistent oxidative stress, glutathione regeneration fails to match its depletion rate, resulting in a disrupted glutathione/GSSG ratio that exacerbates cellular damage and functional decline. Aberrant activation of cytochrome P450-mediated pathways, coupled with glutathione exhaustion, drives a self-amplifying cycle of oxidative injury. This dynamic interplay highlights the central role of ACE2 in hepatic homeostasis, wherein its deletion disrupts the equilibrium between metabolic detoxification and antioxidant defense, ultimately aggravating liver injury.
Amino acid metabolism, a critical biosynthetic process, is essential for protein synthesis, energy production, intracellular signaling and maintenance of physiological homeostasis (78). As a key mediator of amino acid transport, ACE2 deletion may impair hepatic amino acid flux, indirectly disrupting the metabolic adaptability of immune cells and exacerbating immune dysregulation. KGML network analysis identified 'alanine, aspartate and glutamate metabolism' as a central hub whose dysfunction may obstruct urea cycling, impair antioxidant defenses and dysregulate lipid metabolism, potentially precipitating hepatic encephalopathy. Proteomic and metabolomic analyses revealed elevated l-glutamic acid levels, and downregulated expression levels of Adss1, Oat, Got1 and Ass1 in ACE2KO livers, indicating multipathway suppression. Glutamate, a polar amino acid integral to hepatic growth, protein turnover, ammonia detoxification and redox defense, exhibits pathological accumulation that is linked to systemic metabolic network disruption (79-81). Liao et al (82) demonstrated that glutamate was directly involved in hepatic de novo fatty acid synthesis and served a pivotal role in tricarboxylic acid cycle-driven lipogenesis. However, excess glutamate levels suppressed hepatic glutamine synthetase activity, thereby impairing the ammonia detoxification capacity and inducing pathological hyperammonemia. Concurrently, glutamate overaccumulation in the central nervous system triggers neuronal hyperexcitability through overactivation of N-methyl-D-aspartate- and α-amino-3-hydroxy-5-methyl-4-isoxazoleproprionic acid-type glutamate receptor ion channels (83).
ASS1, a urea cycle enzyme that catalyzes argininosuccinate synthesis from citrulline and aspartate, facilitates ammonia detoxification (84). Hepatic ammonia is alternatively neutralized via glutamine synthetase-mediated conversion of glutamate to glutamine (85). Downregulation of Adss1 and Ass1 in ACE2KO mice may impair ammonia clearance and purine synthesis, triggering compensatory glutamate overproduction to enhance glutamine synthesis. Concurrent suppression of Oat and Got1 disrupts ornithine-glutamate axis function, impairing proline biosynthesis and mitochondrial energy metabolism, thereby exacerbating redox imbalance. These findings, which revealed the systemic imbalance in amino acid metabolic pathways caused by ACE2 deletion, including impaired ammonia clearance, disrupted lipid metabolism and exacerbated redox imbalance, suggest that ACE2, in addition to its role in RAS modulation, regulates amino acid metabolic networks to maintain nitrogen homeostasis and oxidative defenses. Its deficiency may precipitate metabolic collapse, thereby providing the molecular basis for fatty liver disease and hepatitis progression.
The present study has several limitations. First, the relatively small sample size in each group may constrain the generalizability of the conclusions, despite rigorous statistical validation and repeated experimental replicates. Expanding the sample size in future studies will strengthen the robustness and reproducibility of the multi-omics findings. Second, while integrated transcriptomic, proteomic and metabolomic analyses delineated key pathway perturbations induced by ACE2KO, functional validation of core molecules (such as Prdm4, Fabp1, Cps1 and Gstm1) remains incomplete. Subsequent investigations should employ liver-specific KO/overexpression models and in vitro assays to clarify their roles in lipid metabolism, oxidative stress and amino acid dysregulation, as well as to evaluate their therapeutic potential. Third, the focus on the static metabolic impacts of ACE2KO warrants complementary dynamic analyses, such as time-resolved multi-omics or isotope tracing, to elucidate the real-time metabolic flux reconfiguration. Addressing these gaps will refine the mechanistic understanding of ACE2-driven regulatory networks and inform targeted strategies for metabolic disorder interventions.
Supplementary Data
Availability of data and materials
The metabolomics data generated in the present study may be found in the MetaboLights repository under accession number MTBLS12389 or at the following URL: https://www.ebi.ac.uk/metabolights/editor/MTBLS12389/descriptors. The RNA-sequencing data may be found in Gene Expression Omnibus database under accession number GSE294830 or at the following URL: https://www.ncbi.nlm.nih.gov/geo/query/acc.cgi?acc=GSE294830. The proteomics data may be found in the ProteomeXchange Consortium via PRIDE under accession number PXD063359 or at the following URL: www.ebi.ac.uk/pride/archive/projects/PXD063359. The other data generated in the present study may be requested from the corresponding author.
Authors' contributions
SX, JG, PJ and FS conceptualized the research framework and co-designed the experimental methodology. YS, NL and SZ performed animal experiments. JC and BY conducted statistical analyses and confirmed the authenticity of all the raw data. SX and JG drafted the first manuscript, while FS and BY analyzed and interpreted the data, and reviewed and revised the manuscript. PJ led methodological validation, secured funding and ensured compliance with ethical standards. All authors contributed to iterative revisions, and have read and approved the final version of the manuscript.
Ethics approval and consent to participate
The animal study was approved by the Ethics Committee of Jining First People's Hospital (approval no. JNRM-2022-DW-011; Jining, China).
Patient consent for publication
Not applicable.
Competing interests
The authors declare that they have no competing interests.
Acknowledgments
Not applicable.
Funding
The present study was supported by the National Natural Science Foundation of China (grant nos. 82272253 and 81602846), the Key R&D Program of Jining (grant nos. 2023YXNS003, 2022YXNS121 and 2023YXNS003), and the Science and Technology Development Fund of the Affiliated Hospital of Xuzhou Medical University (grant no. XYFC202403).