A novel glutamine metabolism‑related risk model for prognostic prediction of liver hepatocellular carcinoma
- Authors:
- Published online on: June 20, 2025 https://doi.org/10.3892/ol.2025.15149
- Article Number: 403
-
Copyright: © He et al. This is an open access article distributed under the terms of Creative Commons Attribution License.
Abstract
Introduction
Hepatocellular carcinoma (HCC) is one of the most prevalent malignancies globally, accounting for 80% of all liver cancers. In 2022, there were ~866,000 new cases of HCC worldwide and about 760,000 deaths attributed to this disease. Although the age-standardized incidence and mortality rates have shown some regional variation, the overall burden of HCC remains high, particularly in East Asia and Africa. The prognosis remains poor, with a median survival time of approximately 6 to 10 months (1). Consequently, there is a pressing need to identify new molecular biomarkers of pathogenicity to enhance clinical decision-making processes and treatment strategies. Moreover, cancer cells undergo notable metabolic alterations and vie with the neighboring normal cells for nutritionally scarce resources to support their rapid proliferation (2). Therefore, comprehending these changes is crucial for elucidating potential biomarkers and therapeutic targets in HCC.
In cancer cells, metabolism is enhanced through several pathways to provide energy and reduce oxidative stress, thereby enabling the proliferation and survival of these cells. These pathways are associated with mutations in oncogenic genes (3). To ensure growth and survival, cancer cells must undergo notable metabolic alterations (4). Furthermore, metabolic reprogramming, especially concerning aerobic glycolysis and glutamine metabolism, has been reported to be strongly associated with patient outcomes (5). The oncogenic reprogramming of glutamine metabolism into the tricarboxylic acid (TCA) cycle, a process driven by glutaminase (GLS) that is termed glutaminolysis, fulfills an important role in cancer cell proliferation (6). A previous study reported that metabolic reprogramming markedly influenced the sensitivity of tumor cells to standard first-line chemotherapeutic agents (7). For example, in pancreatic cancer, the metabolic reliance on glutamine has been reported to support cellular proliferation, thereby affecting drug responses, facilitating tumor growth and metastasis (8). In addition, metabolic reprogramming is closely associated with the tumor immune microenvironment (TME) (9). Ketoglutarate produced via glutamine catabolism has been reported to be essential in polarization, functional maintenance and disease regulation of M2-type macrophages through metabolic reprogramming and signaling pathway activation (10). In addition, tumor cell glutamine utilization may serve as a metabolic checkpoint, inhibiting immune cell-mediated antitumor responses (11). The expression of enzymes involved in glutamine metabolism is known to vary widely among different cancer types (12,13). However, at present, the role of glutamine metabolism in liver hepatocellular carcinoma (LIHC) has yet to be fully elucidated.
Glutamate-oxaloacetate transaminase (GOT) exists in both a cytosolic form (termed GOT1) and a mitochondrial form (termed GOT2). Glutamine is converted into aspartate by GLS and mitochondrial GOT2, and aspartate is subsequently converted into pyruvate by cytosolic GOT1, malate dehydrogenase 1 and malic enzyme 1. However, the involvement of genes associated with glutamine metabolism that would enable predictions of treatment efficacy and clinical prognosis to be made warrants further investigation (14). Studying the molecular triggers of glutamine dependency may improve the effectiveness of therapies that are focused on glutamine metabolism.
Multi-omics data is a large-scale dataset that systematically studies the composition and function of molecules at different levels in an organism through high-throughput technology, covering genome, transcriptome, proteome, metabolome and other levels. The core objective of multi-omics is to comprehensively analyze the complexity of biological systems, and to reveal the underlying mechanisms of diseases, the precise details of cellular processes and environmental interactions (15,16). The present study was performed using multi-omics data, with the aim of assessing the molecular alterations and clinical relevance of genes associated with glutamine metabolism in LIHC. In addition, different glutamine metabolism-related clusters representing different prognostic and microenvironmental characteristics were constructed. A glutamine metabolism-related model with different prognostic, immune and drug sensitivity characteristics was established. The key gene that was identified through these analyses, GOT2, may provide insights into the diagnosis and precise treatment of LIHC.
Materials and methods
Data acquisition
RNA-sequencing (RNA-seq) data and corresponding clinical information of the LIHC samples was obtained from The Cancer Genome Atlas (TCGA) database (www.cancer.gov/tcga) and International Cancer Genome Consortium (ICGC) dataset. RNA-seq and clinical data from 374 patients with LIHC and 50 adjacent normal tissues were obtained from TCGA (Project ID: TCGA-LIHC; http://portal.gdc.cancer.gov/) and external validation data were retrieved from the ICGC (Study ID: LIRI-JP; http://dcc.icgc.org/), which comprised 232 cases of LIHC. Moreover, a list of 21 genes encoding proteins involved in glutamine metabolism was compiled from previous studies (3), and these genes were defined as glutamine metabolism-related genes (GMGs). Copy number variations (CNVs) were analyzed using the GISTIC 2.0 algorithm (gatkforums.broadinstitute.org; parameters: q-value <0.25; confidence level, 99%), and data were visualized via the cBioPortal platform. The protein expression data of the genes were obtained from the Clinical Proteomic Tumor Analysis Consortium (CPTAC) database, and protein expression validation was performed utilizing data from the CPTAC (Dataset ID: CPTAC-LSCC; http://proteomics.cancer.gov/). Furthermore, reverse transcription-quantitative PCR (RT-qPCR) was performed to assess the RNA expression of the modeled genes in LIHC cells. Protein expression data of GOT2 in LIHC and adjacent normal liver tissue were obtained from the Human Protein Atlas (HPA) database (proteinatlas.org/), specifically using dataset HPA018139. This dataset includes immunohistochemical staining results comparing tumor and adjacent non-tumor tissues, which were used to evaluate differential protein expression.
Cluster analysis
Prognostic GMGs were screened using univariate Cox regression analysis. Principal component analysis (PCA) was performed using the R package ‘FactoMineR’ (v2.4) to distinguish molecular clusters. Patients with LIHC were then classified by consensus clustering on the basis of the prognostic GMG expression profile. The Kaplan-Meier (KM) method was utilized to estimate the difference in overall survival (OS) rates between clusters. To further analyze the differences in biological pathways between clusters, differentially expressed genes (DEGs) were identified using the R package ‘DESeq2’ (v1.30.1) with thresholds |log2FoldChange(FC)|>2 and adjusted P<0.001. The DEGs were subsequently analyzed using the Gene Ontology (GO; geneontology.org/) and Kyoto Encyclopedia of Genes and Genomes (KEGG) databases (genome.jp/kegg/). Pathway enrichment analysis was performed using ‘clusterProfiler’ (v4.0.5) using the KEGG 2021 database. In addition, gene set variation analysis (GSVA) was performed to evaluate pathway enrichment for different clusters with the R package GSVA and ‘c2.cp.kegg.v7.4.symbols’ from the Molecular Signatures Database. Univariate Cox analysis was used to screen prognostic DEGs between molecular clusters. Finally, based on the expression levels of prognostic DEGs, patients with LIHC were divided into two gene clusters via R package ConsensusClusterPlus (version 1.60.0; bioconductor.org/packages/release/bioc/html/ConsensusClusterPlus.html).
Evaluation of the immunogenomic landscape
Immune cell infiltration and functional pathways were evaluated using the single sample gene set enrichment analysis (ssGSEA) algorithm. The ssGSEA algorithm was exploited to assess the expression of immunosuppressive cells and immune functional pathways in each LIHC sample. Estimation of Stromal and Immune cells in Malignant Tumor tissues (ESTIMATE) was utilized to measure the immune cell infiltration level (immune score), tumor purity and stromal content (stromal score) for each respective LIHC sample. TME scores (stromal, immune and ESTIMATE scores) were calculated using the ESTIMATE R package (v1.0.13).
Construction of the glutamine metabolism-related signature (GMS)
Least absolute shrinkage and selection operator (LASSO) and multivariate Cox regression analyses were used to screen for genes that were prognostically related, and to construct prognostic models. The GMS formula was obtained through the linear combination of gene expression weighted regression coefficients. The algorithm used was as follows: GMS=Coef A × Gene A expression + Coef B × Gene B expression + C × Gene C expression + ......Coef N × Gene N expression, with ‘Coef’ referring to the coefficient calculated by multivariate Cox analysis, and ‘Gene X expression’ referring to the expression of the different GMGs. Patients with LIHC were divided into high- or low-GMS groups based on the median GMS. Univariate and multivariate Cox regression analyses were subsequently used to evaluate the independence of the GMS and other clinical phenotypes. In this analysis, the ICGC data were utilized as an external independent validation cohort to further evaluate the accuracy and stability of the GMS.
Mutation and drug-sensitivity analysis
The ‘maftools’ R package was utilized to analyze differences in somatic mutations between high- and low-GMS groups. The difference in tumor mutational burden (TMB) expression between the two groups was further analyzed. KM curves were utilized to assess the difference in survival between the mutation and the GMS combination, and to further evaluate the association between the mutation and the GMS. In the targeted therapy drug analysis, the ‘pRRophetic’ package was used to evaluate the half-maximum inhibitory concentration (IC50) values of six common cancer chemotherapy drugs (namely, axitinib, cisplatin, doxorubicin, gefitinib, gemcitabine and mitomycin C).
Cell culture and transfection
Human LIHC Hep3B (SCSP-5045), Huh7 (SCSP-526) and HCCLM3 (TCHu270) cell lines were purchased The Cell Bank of Type Culture Collection of The Chinese Academy of Sciences, and the human hepatic epithelial THLE-2 (CL-0833) cell line was purchased from Pricella® (Wuhan Elabscience Biotechnology Co., Ltd.). The cells were cultured in DMEM (Gibco; Thermo Fisher Scientific, Inc.) with 1% penicillin/streptomycin and 10% fetal bovine serum (Gibco; Thermo Fisher Scientific, Inc.) in a temperature-controlled incubator set at a constant 37°C in an atmosphere containing 5% CO2.
Small interfering (si)RNAs targeting GOT2 were constructed by Shanghai GenePharma Biotechnology Co. Ltd. The following sequences were used: si-GOT2, 5′-CCGGAACAGUGGAAGGAAATT-3′ and 5′-GACGACGACUACAUUGAACAATT-3′; and si-negative control (NC), 5′-UUCUCCGAACGUGUCACGUTT-3′ and 5′-UUUCCUUCCACUGUUCCGGTT-3′. Briefly, 6×10⁵ Huh7 and HCCLM3 cells were seeded in a 6-well plate and allowed to reach ~80% confluence after 24 h of culture at 37°C. A mixture of 50 nmol/l siRNA and 7.5 µl Lipofectamine™ 3000 (Invitrogen™; Thermo Fisher Scientific, Inc.) was incubated at room temperature for 15 min, and then added to the cells. The cells were harvested after 48 h of culture at 37°C for subsequent experiments.
Cell proliferation assay
Individual 96-well plates were used to plate 1×10³ Huh7 or HCCLM3 cells, which were subsequently divided into test and control groups. DMEM (100 µl; Thermo Fisher Scientific, Inc.) and Cell Counting Kit-8 (CCK-8) solution (10 µl; Guangzhou RiboBio Co., Ltd.) were added to each well of the plate to cover 1,000 cells for 2 h. Following the manufacturer's instructions, cell absorbance was measured at 450 nm after 0, 24, 48 and 72 h of growth using a microplate reader.
A 5-ethynyl-2′-deoxyuridine (EdU) DNA Cell Proliferation Kit (Guangzhou RiboBio Co., Ltd.) was used to perform Cell-Light EdU tests to assess the ability of cells to proliferate. Each well in a 24-well plate contained 50,000 cells. Following the culture, cells were fixed with 4% paraformaldehyde for 15 min at room temperature after having been exposed to a 50 mmol/l EdU solution for 2 h. The cellular strains were then treated with Apollo Dye Solution and DAPI for 10 min at room temperature following the instructions in the kit, and an Olympus FSX100 microscope (Olympus Corporation) was used for. Cells in three randomly selected areas of each well were counted to determine the proportions of EdU-positive cells.
Western blotting
HCC cells and tissue samples were lysed in Radio-Immunoprecipitation Assay Lysis Buffer (Beyotime Institute of Biotechnology). Protein concentrations were determined using an enhanced BCA protein assay kit (Beyotime Institute of Biotechnology). Proteins were separated using 10% SDS-PAGE (30 µg protein was loaded to each lane and transferred to a PVDF membrane (MilliporeSigma; Merck KGaA). The membranes were subsequently blocked with 3% BSA (Beyotime Institute of Biotechnology) for 2 h at room temperature and incubated with primary antibodies against GOT2 (cat. no. 14800-1-AP; Proteintech Group, Inc.) and GAPDH (both 1:1,000; cat. no. 10494-1-AP; Proteintech Group, Inc.) overnight at 4°C. After washing the membrane three times (15 min each wash) with TBST containing 0.1% Tween, the membranes were incubated with HRP-conjugated secondary antibodies (1:1,000; cat. no. P0948; Beyotime Institute of Biotechnology) for 1 h at room temperature (17). The membranes were washed a further time, and protein expression was visualized using a Super ECL Chemiluminescent Substrate Kit (US Everbright, Inc.) on a chemiluminescence gel-imaging system (Evolution-Capt, Vilber, Inc.). ImageJ software was used for analysis (version 1.53a; National Institutes of Health).
RT-qPCR analysis
Total RNA was extracted from HCC tissue using the Total RNA Isolation Kit V2 (cat. no. RC112-01, Vazyme Biotech Co., Ltd.). Subsequently, cDNA was synthesized using HiScript II Q Select RT SuperMix for qPCR(+gDNA wiper) (cat. no. R233-01, Vazyme Biotech Co., Ltd.). RT was set at 50°C for 15 min, 85°C for 5 sec. RT-qPCR reactions were then performed using the Taq Pro Universal SYBR qPCR Master Mix (cat. no. Q712-02, Vazyme Biotech Co., Ltd.) on the Applied Biosystems™ 7900HT Fast Real-Time PCR System (Thermo Fisher Scientific, Inc.). Initial denaturation at 95°C for 30 sec, followed by 40 cycles of 95°C for 10 sec and an 60°C for 30 sec. The mRNA expression levels were determined using the 2−ΔΔCt method (18), with GAPDH serving as the internal control. The primers used for this analysis were as follows: GOT2, (forward) 5′-TGATGCTGTACCCTCACCCT-3′ and (reverse) 5′-GGGCAGAGACAACATCCCAA-3′); and GAPDH (forward) 5′-TCCAAAATCAAGTGGGGCGA-3′ and (reverse) 5′-AAATGAGCCCCAGCCTTCTC-3′.
Clinical specimens
A total of nine paired LIHC tissues from patients (age, 45–75 years; five male, four female) admitted to the Yixing Branch of Wuxi Medical Center of Nanjing Medical University (Yixing, China) from 2021–2022, who underwent their first radical resection of LIHC tissues and corresponding normal tissues, were retrospectively analyzed. Patients who had received radiotherapy or chemotherapy prior to surgery were excluded. Histological and pathological examination and grading of each specimen was performed by two pathologists The present study was approved by the Ethics Committee of Yixing Branch of Wuxi Medical Center of Nanjing Medical University and written informed consent was obtained from the patients (approval no. 050-01).
Transwell assay
Following the manufacturer's instructions, 200 µl serum-free DMEM medium was used to seed the top chambers of a Transwell plate with 20,000 Huh7 and HCCLM3 cells, respectively, and the setup was separated into test and control batches. Transwell chambers (Corning, Inc.) were used to assess the migration rate of the cells. A total of 700 µl DMEM media with 10% fetal bovine serum (Gibco; Thermo Fisher Scientific, Inc.) was added to the bottom chamber. After incubating the cells for 24 h at 37°C, the top chamber was lifted out, the cells were aspirated with serum-free media and subsequently fixed with 4% paraformaldehyde for 10 min at room temperature. After staining for 15 min with crystal violet at room temperature (Shenzhen Kaigeng Technology Co., Ltd.), the samples were washed with PBS. The cellular strains were observed under a light microscope, and counts of cells were obtained from five different fields of view.
Wound healing assay
In a six-well plate, serum-starved 50×104 Huh7 and HCCLM3 cells were cultivated and allowed to reach ~80% confluence. The combined cell monolayer was manually scratched in a linear fashion using a normal 20-µl pipette tip. After removing floating cells by washing with PBS, medium was added and the cells were incubated at 37°C for 24 h. The widths of the wounds were measured by capturing images at 0 and 24 h using an inverted microscope. For every group, three sets of experiments were performed.
Statistical analysis
The data are presented as the mean ± standard deviation. All statistical analyses were performed using GraphPad Prism 8.0 (Dotmatics) and R Software (version: 4.0.2) (r-project.org/). P<0.05 was considered to indicate a statistically significant difference. χ2 test was used to analyze the statistical significance between two sets of categorical variables. Unpaired Student's t-test or one-way ANOVA followed by Dunnett's post hoc test were used for comparative analyses across difference groups within the study.
Results
Genetic variation prognoses of GMGs in LIHC
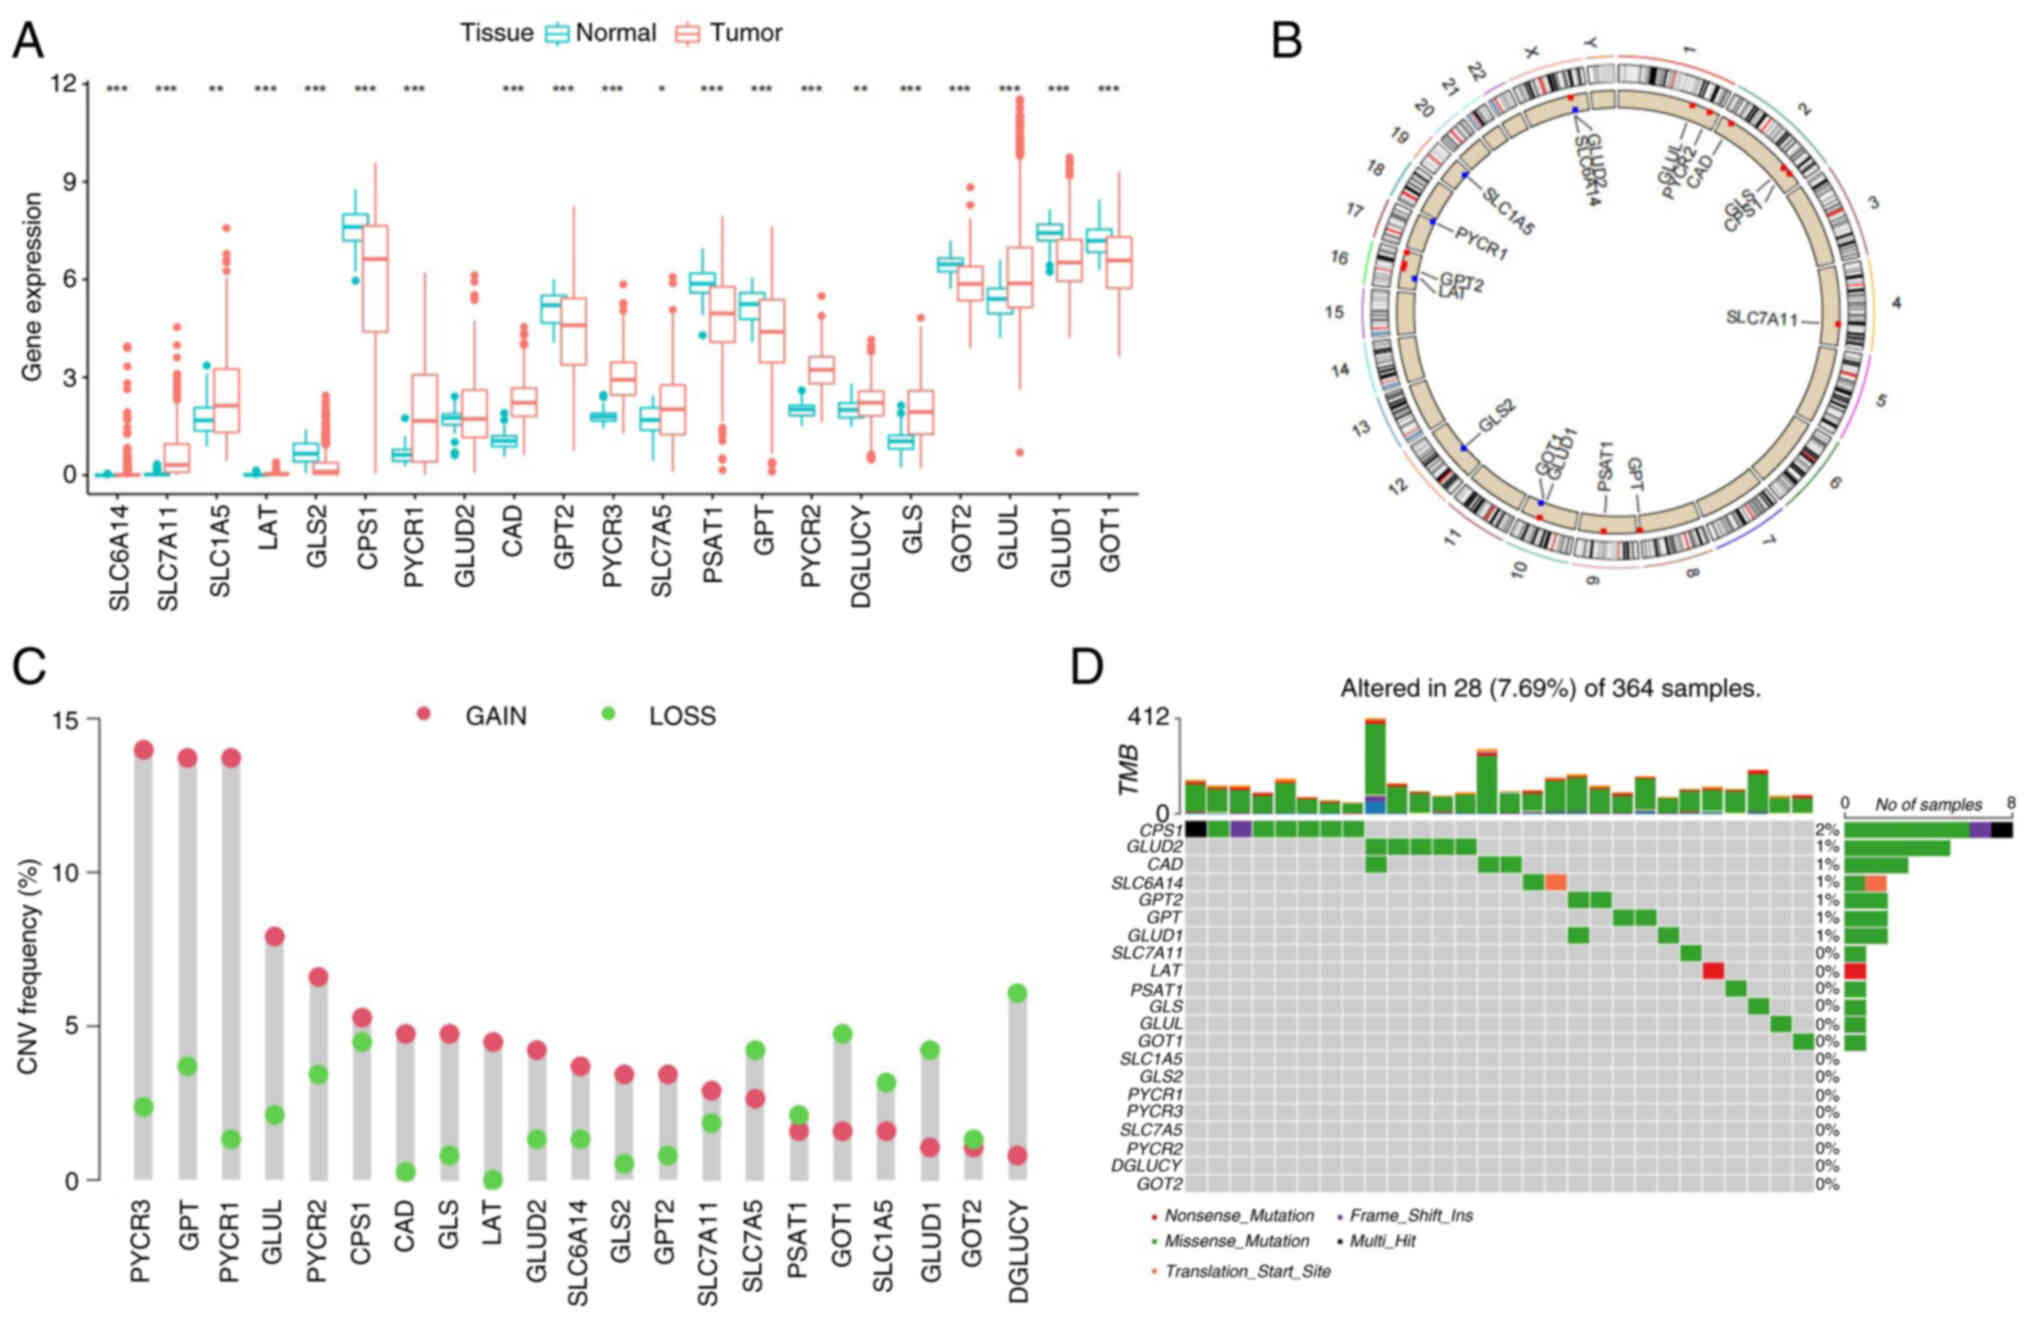
First, the GMGs that were differentially expressed between normal and LIHC tissues were assessed and compared. A total of 21 GMGs were included from the relevant literature (3), of which 20 genes were differentially expressed in normal and LIHC tissues (Fig. 1A). Moreover, the CNV changes of the GMGs on the chromosome were identified (Fig. 1B). Through analyzing the frequency of the CNV changes, it was demonstrated that a prevalent CNV alteration was featured in 21 of the regulators, and the majority of these were associated with an amplification of the copy number, whereas the genes solute carrier (SLC)7A5, GOT1, SLC1A5, glutamate dehydrogenase 1 (GLUD1) and D-glutamate cyclase had a widespread frequency of CNV deletion (Fig. 1C). Among 364 tissue samples, 28 exhibited GMG mutations (frequency, 7.69%). The results obtained revealed that carbamoyl-phosphate synthase 1 (CPS1) had the highest mutation frequency (Fig. 1D). These results suggest that alterations in the CNV may be a prominent factor affecting the expression of GMGs. When compared with normal liver tissue, the expression of GMGs that experienced CNV amplification was significantly higher in LIHC tissues [for example, pyrroline-5-carboxylate reductase (PYCR)1 and PYCR3], whereas the expression of GMGs that had a widespread frequency of CNV deletion was significantly lower (such as GLUD1 and GOT2). Therefore, the inheritance and expression of GMGs were demonstrated to be highly heterogeneous in LIHC and paracancer tissues, suggesting that an imbalance in the expression of GMGs exerts a crucial role in the onset and development of LIHC.
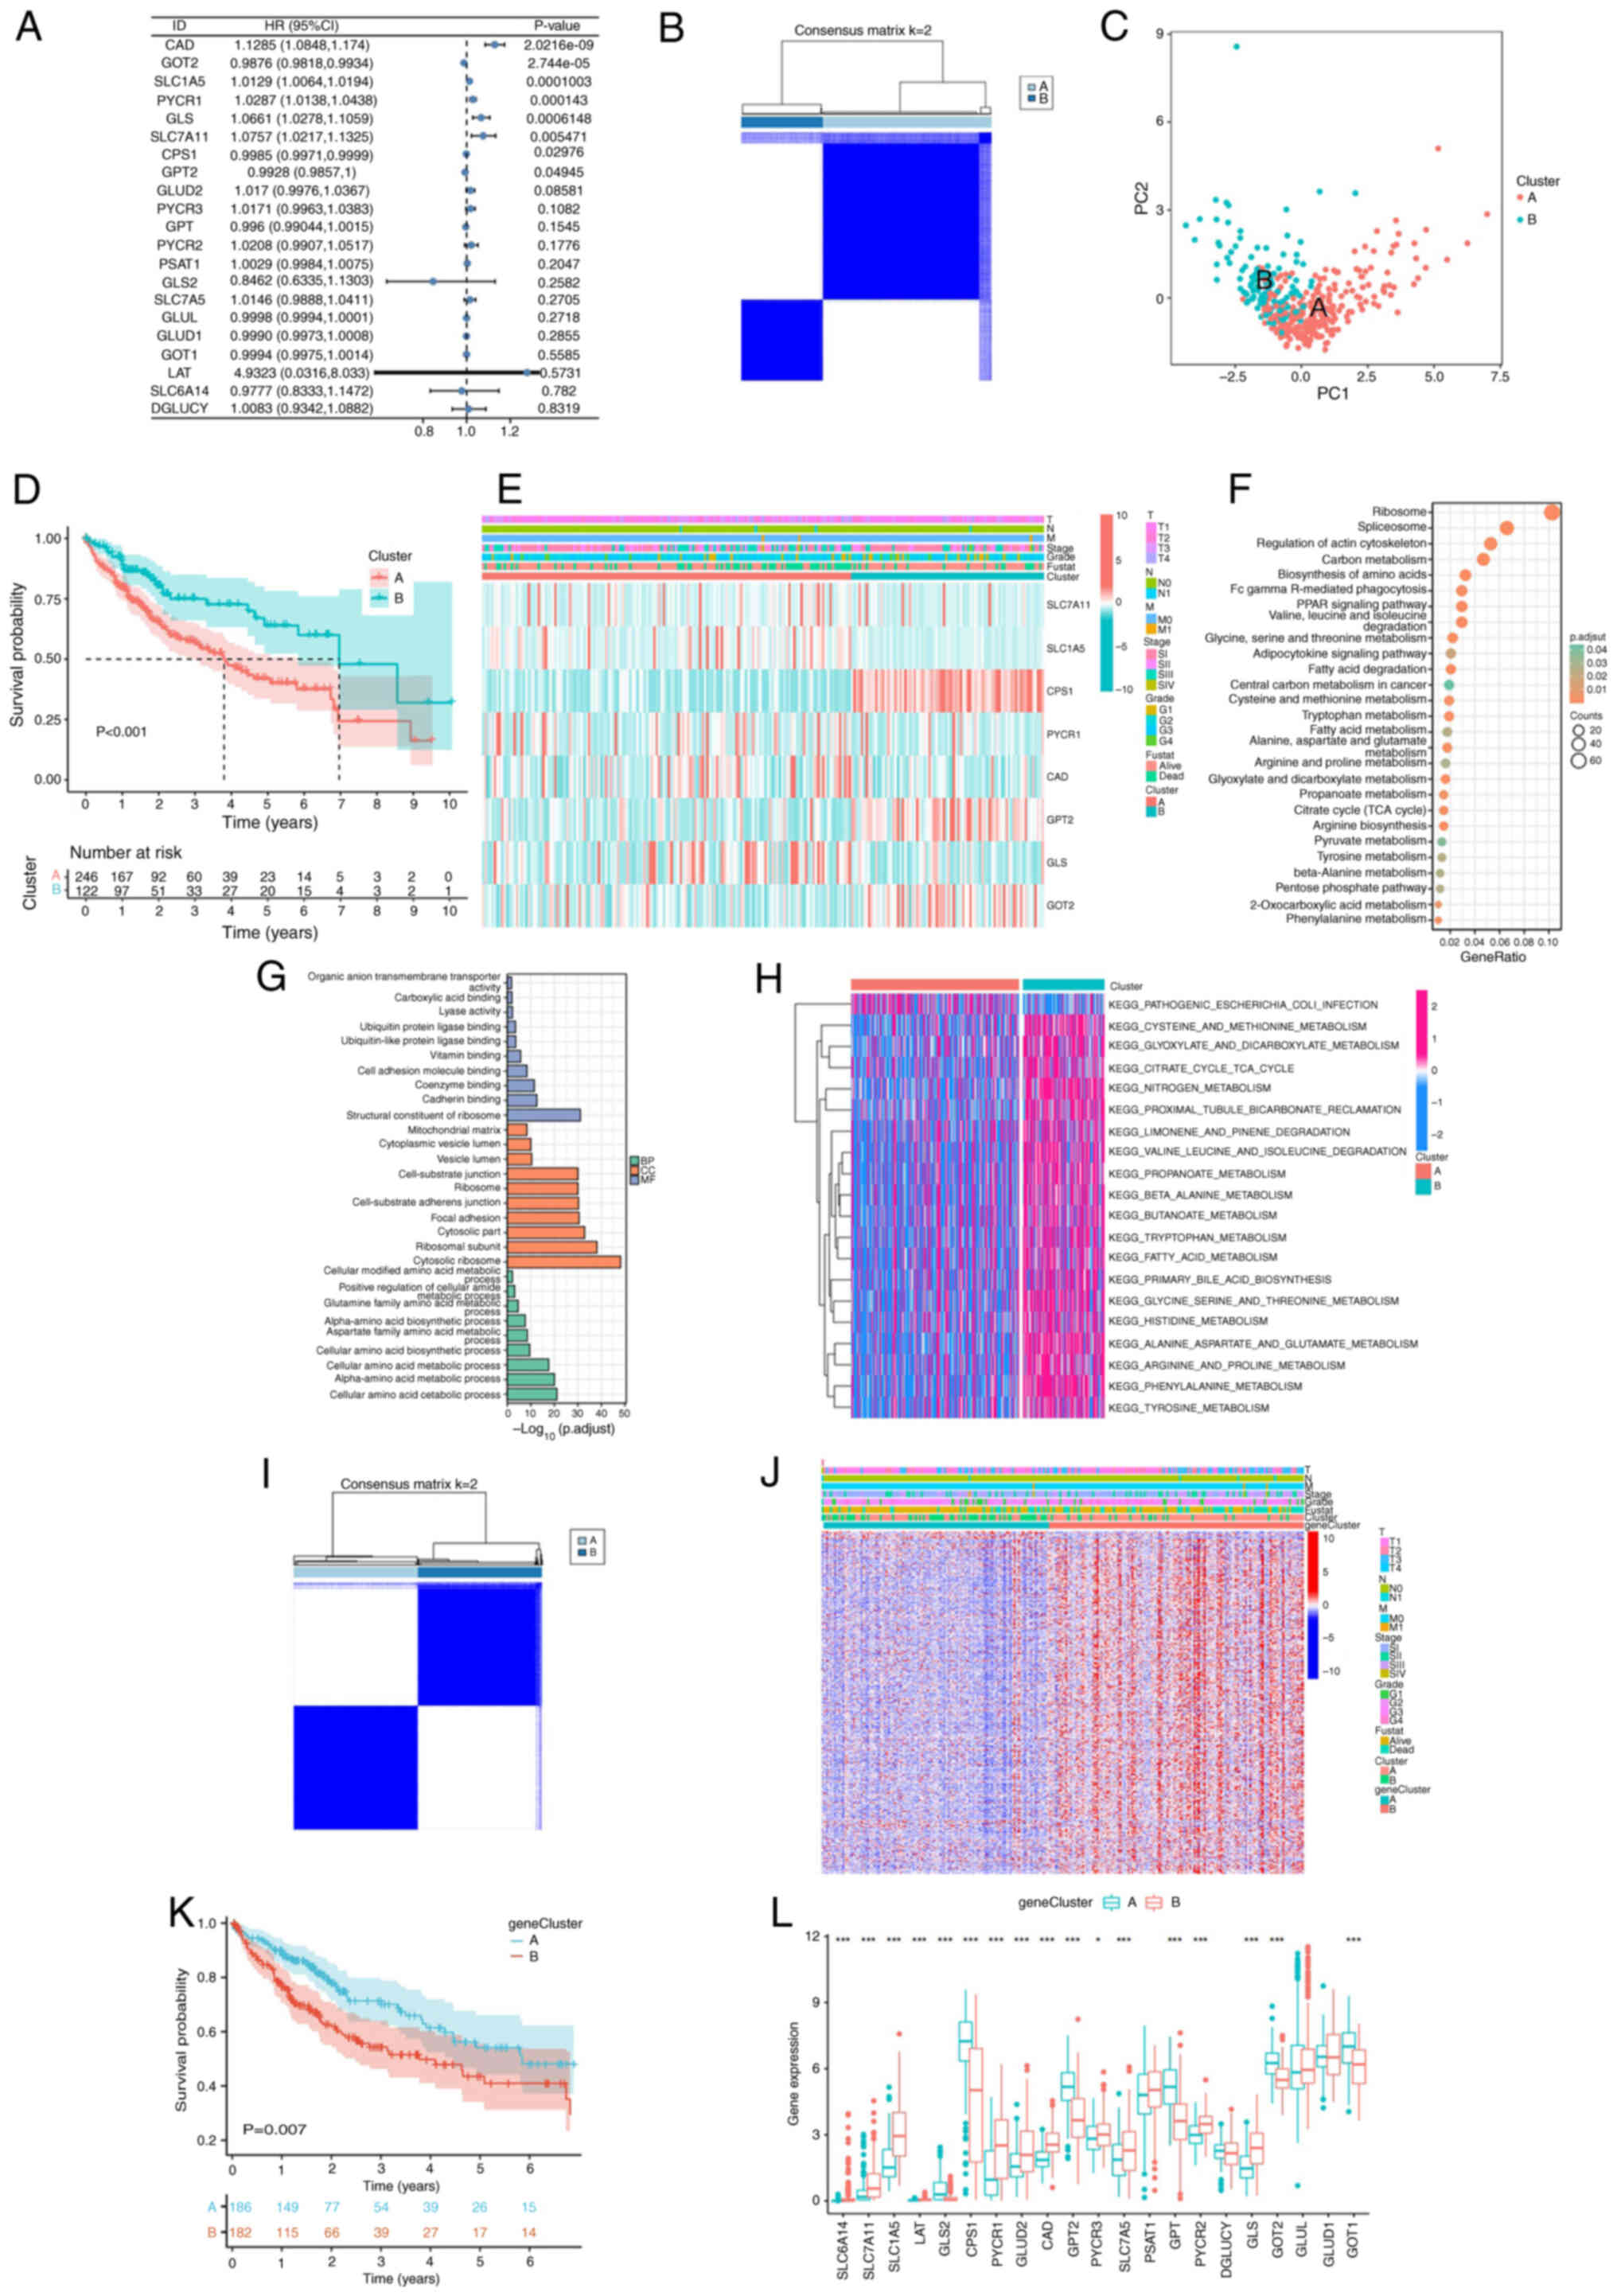
Establishment and biological characteristics of glutamine metabolism-related clusters
Using univariate Cox regression analysis, eight prognostic genes (carbamoyl phosphate synthetase 2-aspartate transcarbamylase-dihydroorotase, GOT2, SLC1A5, PYCR1, GLS, SLC7A11, CPS1 and glutamic-pyruvic transaminase 2) were identified to be associated with glutamine metabolism (P<0.05; Fig. 2A). These genes were selected to stratify patients with LIHC into distinct molecular clusters for subsequent prognostic modeling. According to the expression levels of the eight genes, the ConsensusClusterPlus package was used to divide patients with LIHC into two diverse clusters (Fig. 2B). The results of PCA demonstrated that patients with LIHC could be well distinguished based on the GMGs (Fig. 2C). KM survival curves were constructed, revealing significant differences among the two clusters, with cluster A having the worse prognosis (Fig. 2D). In addition, heatmap analysis demonstrated distinct clinicopathological features and gene distribution between the clusters (Fig. 2E). The screening criteria of DEGs between clusters was set as follows: |log2FC|>2 and adjusted P<0.001. KEGG enrichment analysis revealed that DEGs were significantly enriched in several metabolic pathways, including the citrate cycle (TCA cycle), fatty acid metabolism and amino acid metabolism. In terms of the biological processes of GO analysis, the DEGs were significantly enriched in the amino acid metabolism pathway. In terms of cellular components, the DEGs were significantly enriched in the cytosolic part, focal adhesion and mitochondrial matrix. Finally, in the terms of molecular functions, the DEGs were enriched in the structural constituent of ribosomes, cadherin binding and cell adhesion molecule binding. Furthermore, GSVA analysis revealed that cluster B was significantly enriched in pathways associated with the activation of amino acid metabolism (Fig. 2F-H). To further analyze the role of glutamine metabolism in LIHC, univariate Cox regression analysis was used to select prognostic DEGs between the clusters. Based on the prognostic DEGs expression profiles, the ConsensusClusterPlus package was used to classify patients with LIHC into two gene clusters (Fig. 2I). Heatmap analysis was performed to reveal distinct clinicopathological features and gene distribution between the gene clusters (Fig. 2J).KM survival curve analysis demonstrated that gene cluster B had a worse prognosis compared with gene cluster A (Fig. 2K). Further analysis revealed that the expression of GMGs generally differed among the gene clusters (Fig. 2L).
Immune infiltrate characteristics of glutamine metabolism-related clusters
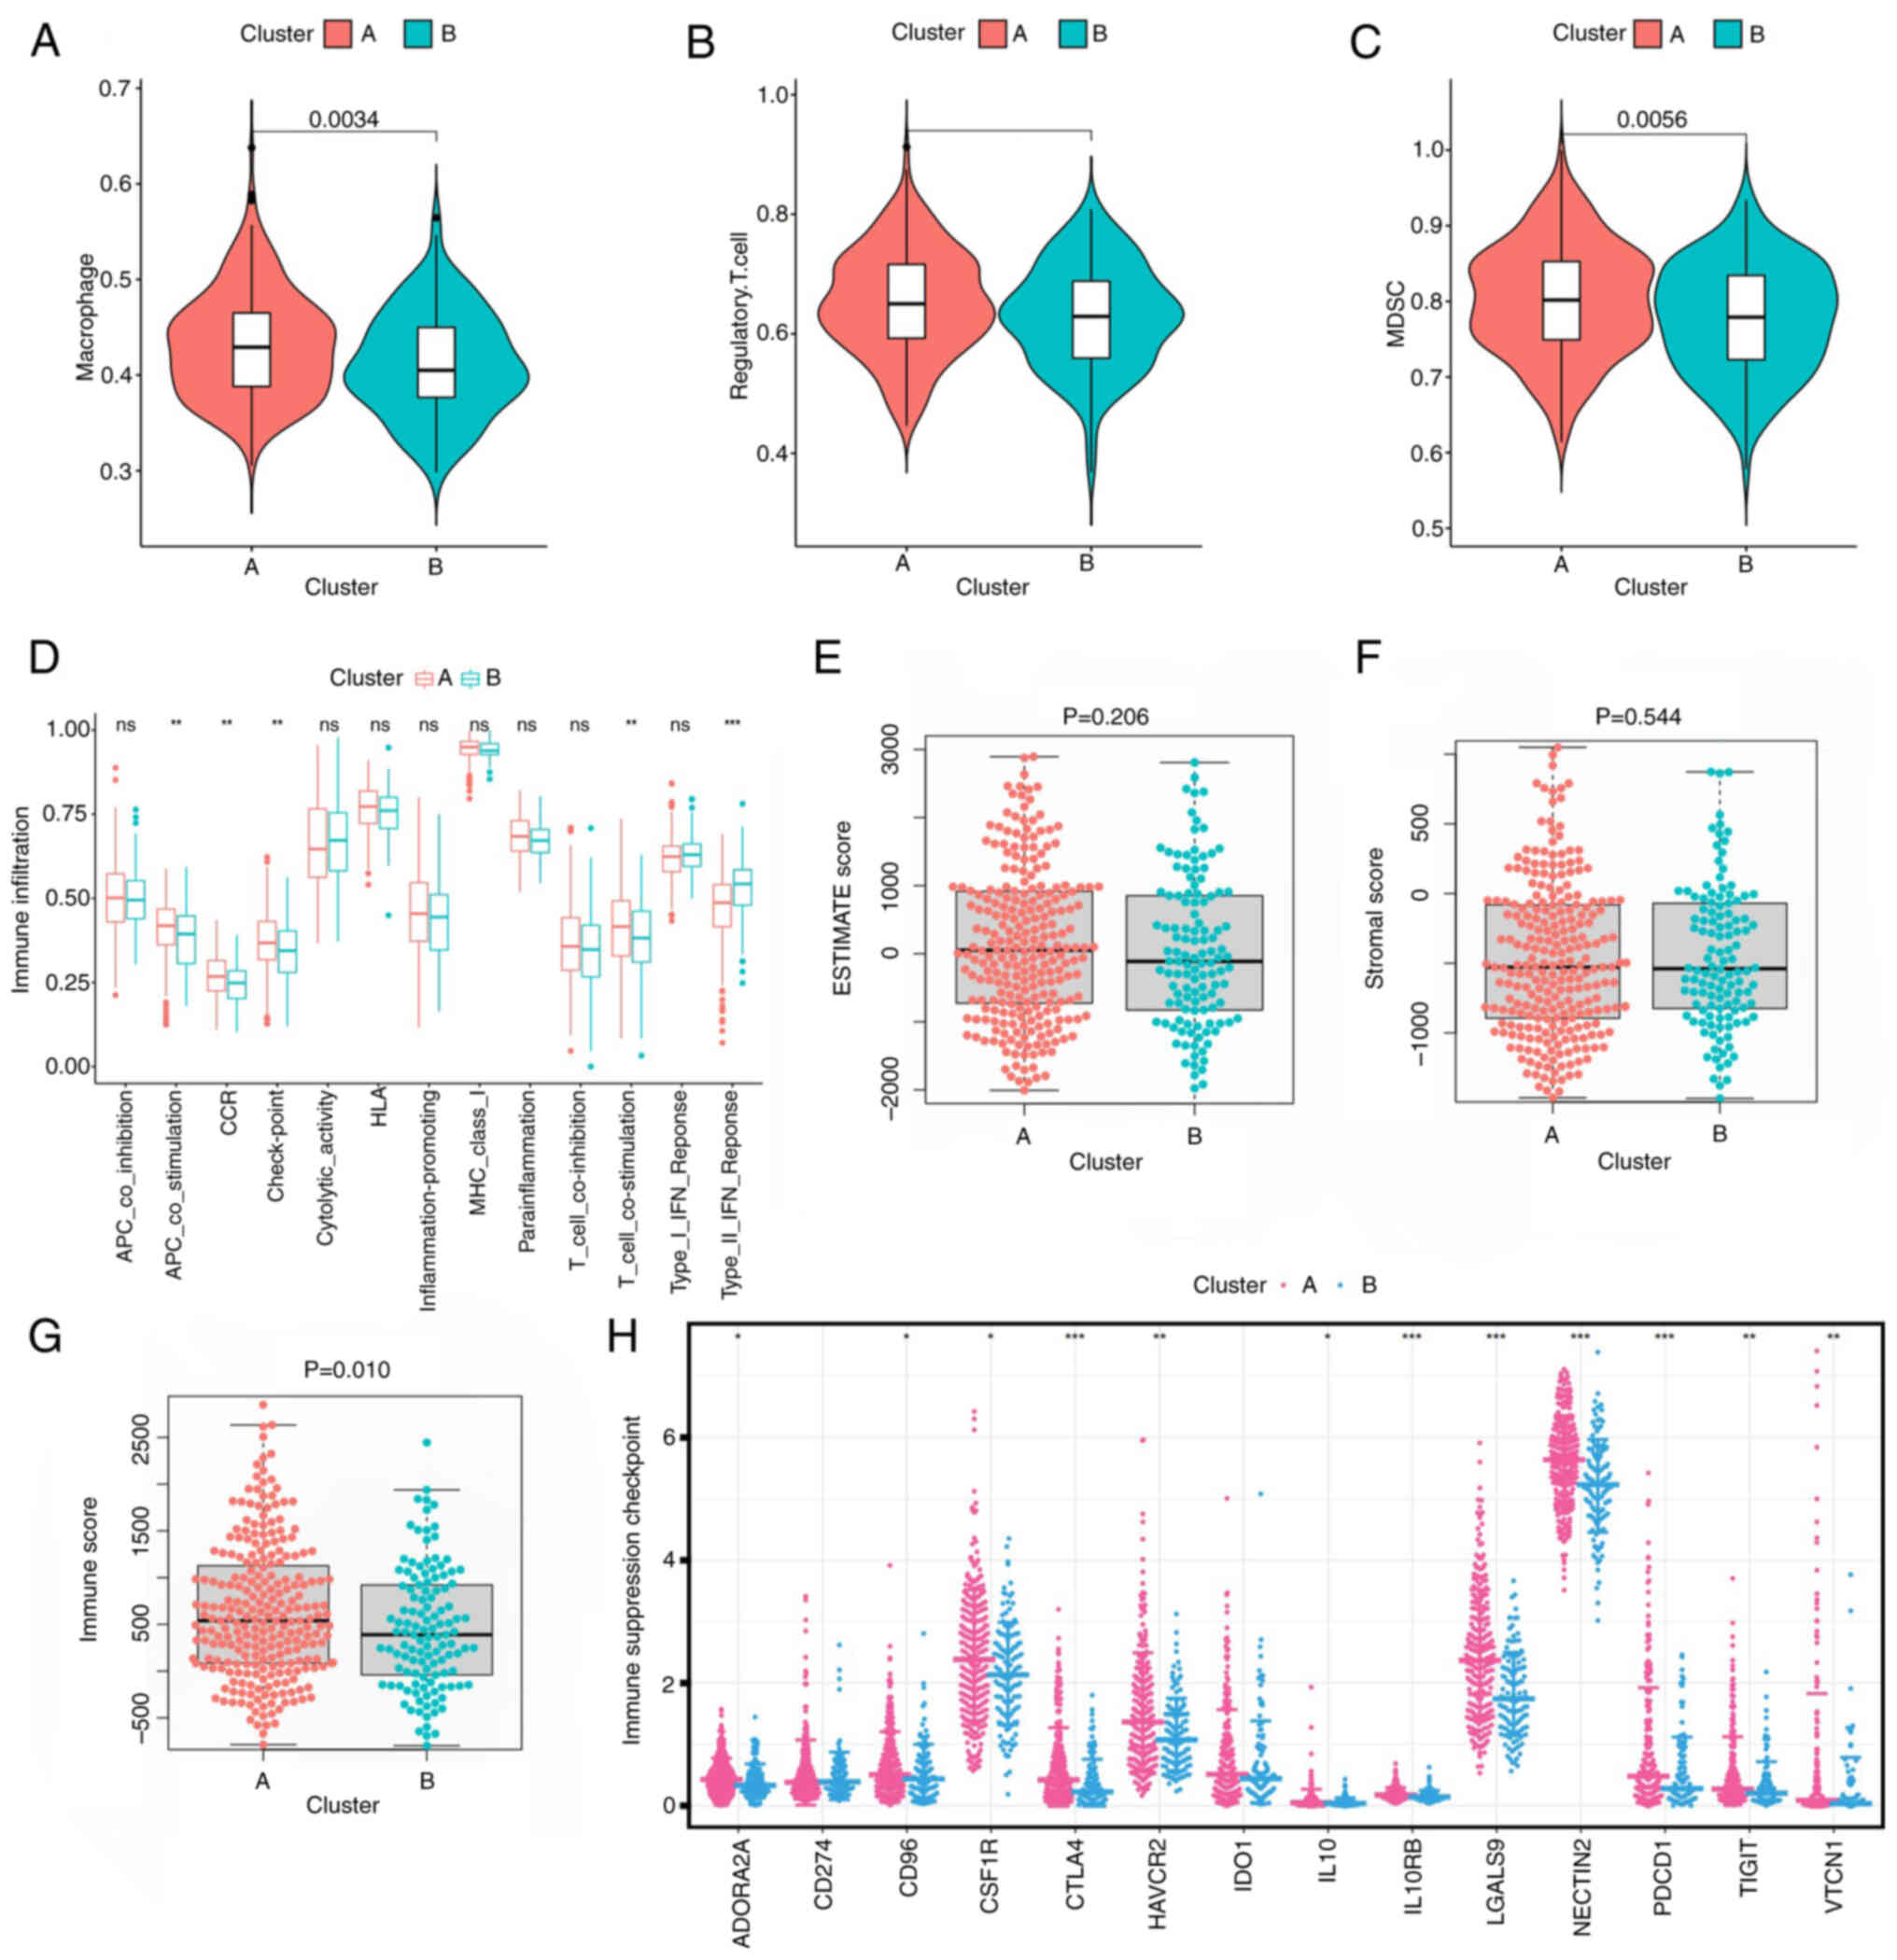
To assess the potential mechanism underlying prognostic differences among glutamine metabolism-related clusters, the association between glutamine metabolic clusters and immune infiltration in the TME was evaluated. The data obtained revealed that immunosuppressive cells (for example, regulatory T cells, macrophages and myeloid-derived suppressor cells) were significantly overexpressed in cluster A compared with in cluster B (Fig. 3A-C). Subsequent immunomolecular functional analysis revealed that checkpoint antigen-presenting cell co-stimulation and T cell co-stimulation were significantly highly expressed in cluster A compared with in cluster B (Fig. 3D). The differential expression of the TME scores comparing between the two clusters was then analyzed. This analysis demonstrated that no statistical difference was identified in terms of the stromal score and tumor purity between the two clusters, although the immune score of cluster A was markedly higher compared with that of cluster B (Fig. 3E-G). In addition, immunosuppressive checkpoint expression was notably different comparing between the clusters, with higher expression in cluster A (Fig. 3H). Taken together, these results suggest that there was a suppression of immunity in the TME of cluster A, which may offer an explanation for the worse prognosis identified for this cluster.
Establishment of the GMS
Univariate Cox regression analysis was performed on 1,248 genes exhibiting differential expression between fractals, leading ultimately to the identification of 709 genes associated with prognosis. Subsequently, LASSO and multivariate Cox regression analyses were applied to these 709 genes, and seven genes were ultimately selected to construct the prognostic model (Fig. 4A-C). The GMS was constructed using the following algorithm: GMS=SF3B4 × 0.0055 + RPS7P1 × 0.0368 + GOT2 × −0.006 + SLC66A1 × 0.0262 + TMEM41B × 0.0437 + YBX1 × 0.0064 + CYB5R3 × 0.0087. The distribution of the modeled genes and clinical features between the high- and low-risk groups was identified (Fig. 4D) and the KM survival curve analysis revealed that the prognosis was significantly worse in the high-risk group compared with that in the low-risk group (Fig. 4E). The area under the curve (AUC) at the 1-, 2- and 3-year receptor operator characteristic (ROC) curves of the model were revealed to be 0.780, 0.752 and 0.748, respectively, demonstrating that the model had a relatively accurate predictive ability (Fig. 4F). The ROC curves compare the predictive performance of the GMS) with several clinicopathological features, including Stage, Grade, and the TNM classification components. GMS (risk score) has superior sensitivity and specificity for predicting 5-year survival in patients with LIHC, with an AUC of 0.767, compared to these traditional clinical variables whose AUC values range from 0.481 to 0.691 (Fig. 4G).
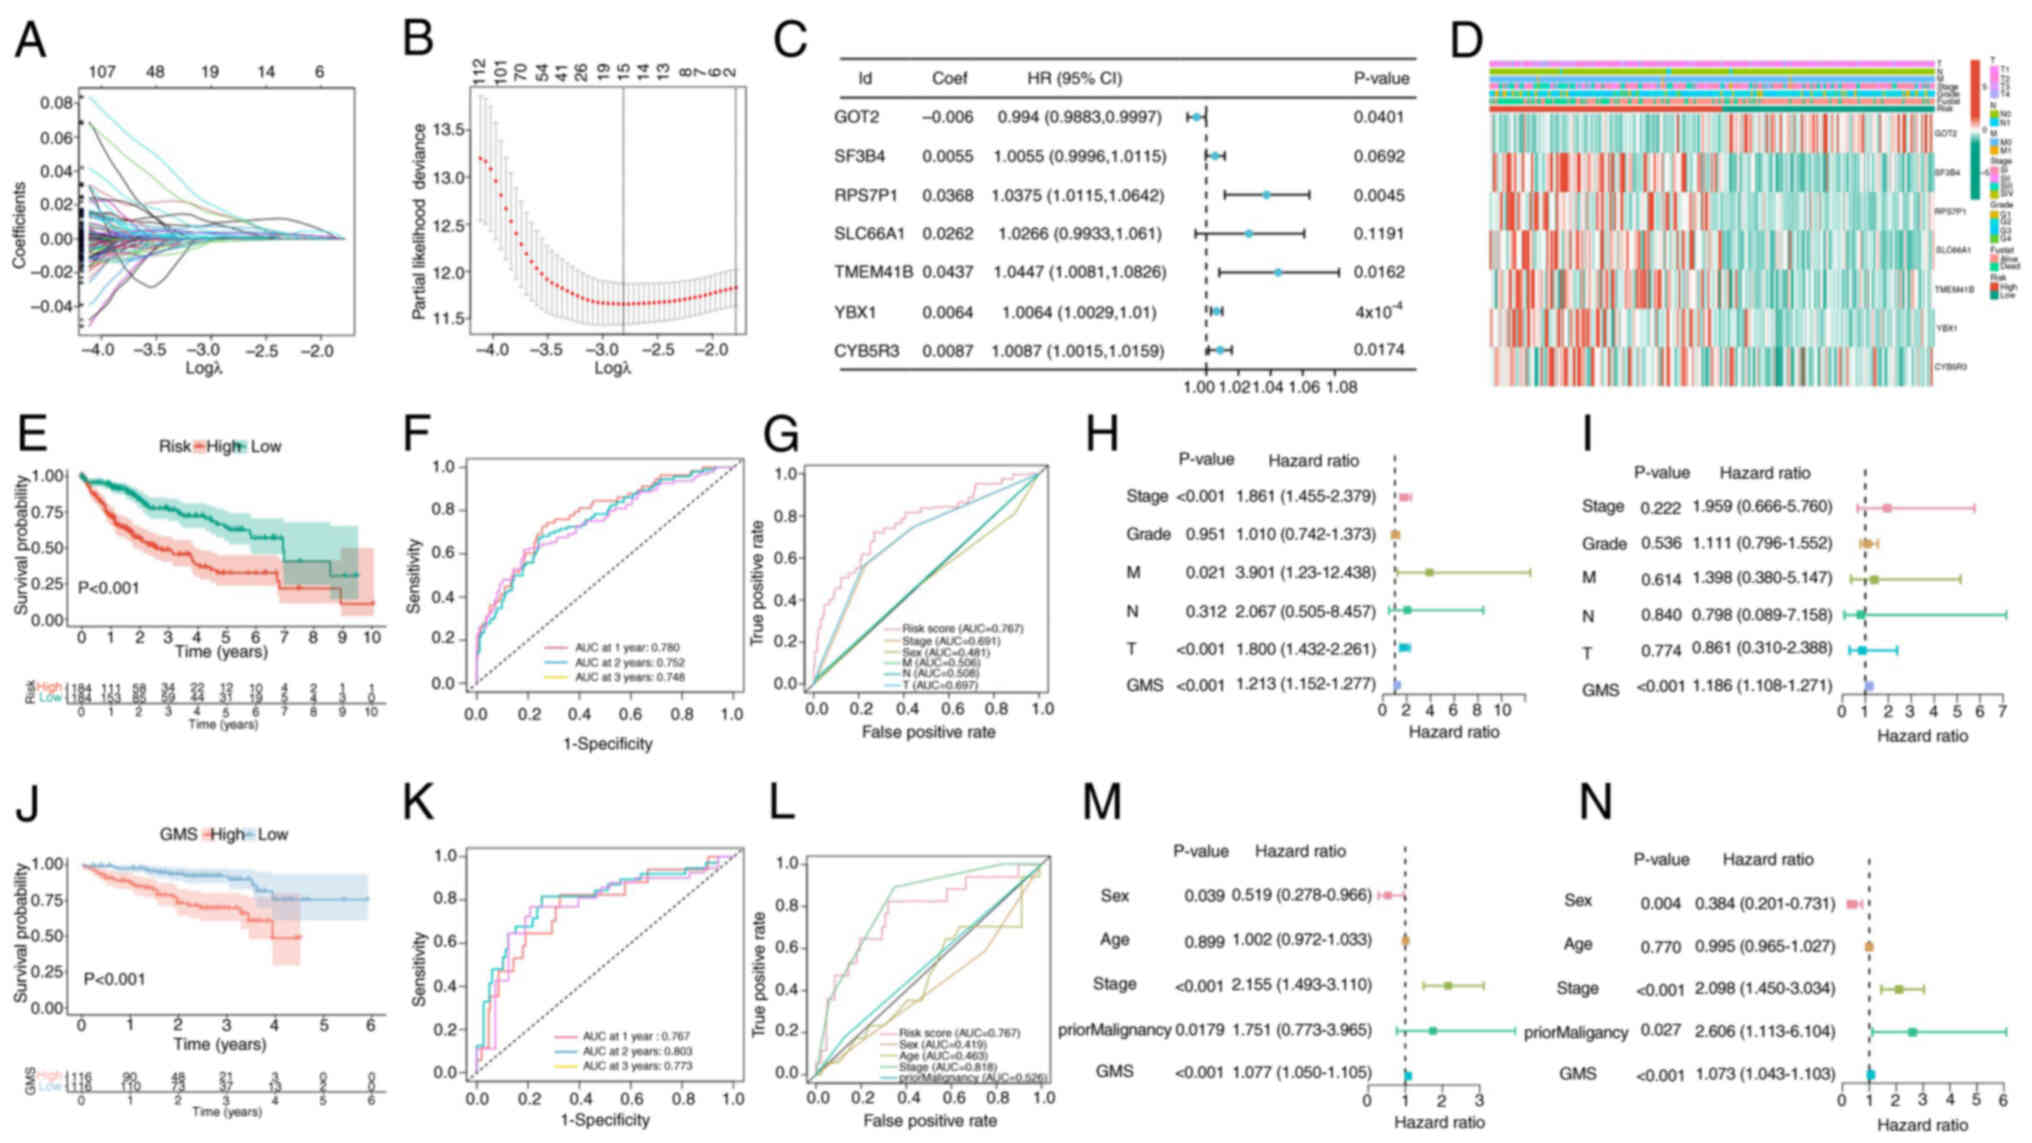
To analyze the prognostic characteristics of the model, univariate and multivariate Cox regression analyses were performed. According to the univariate Cox regression analysis, stage, tumor (T) stage, metastasis (M) stage and risk score were significantly associated with the OS rate of patients (Fig. 4H). In multivariate Cox regression analysis, risk score remained an independent predictor of OS in patients with LIHC (hazard ratio, 1.186; 95% confidence interval, 1.108–1.271; P<0.001; Fig. 4I). The ICGC data set was subsequently used as an external validation set to further verify the accuracy and stability of the model. The KM survival curve analysis indicated that the high-risk score group had a significantly worse prognosis than the low-risk score group (Fig. 4J). In addition, the AUC values for the 1-, 2- and 3-year ROC curves in the ICGC cohort were revealed to be 0.767, 0.803 and 0.773, respectively (Fig. 4K). Furthermore, compared with other clinical factors, the AUC value of this model was still high in the ICGC cohort (Fig. 4L). Univariate and multivariate Cox regression analyses demonstrated that GMS was significantly associated with OS in the ICGC cohort (Fig. 4M and N).
Identification of clinicopathological features of the GMS
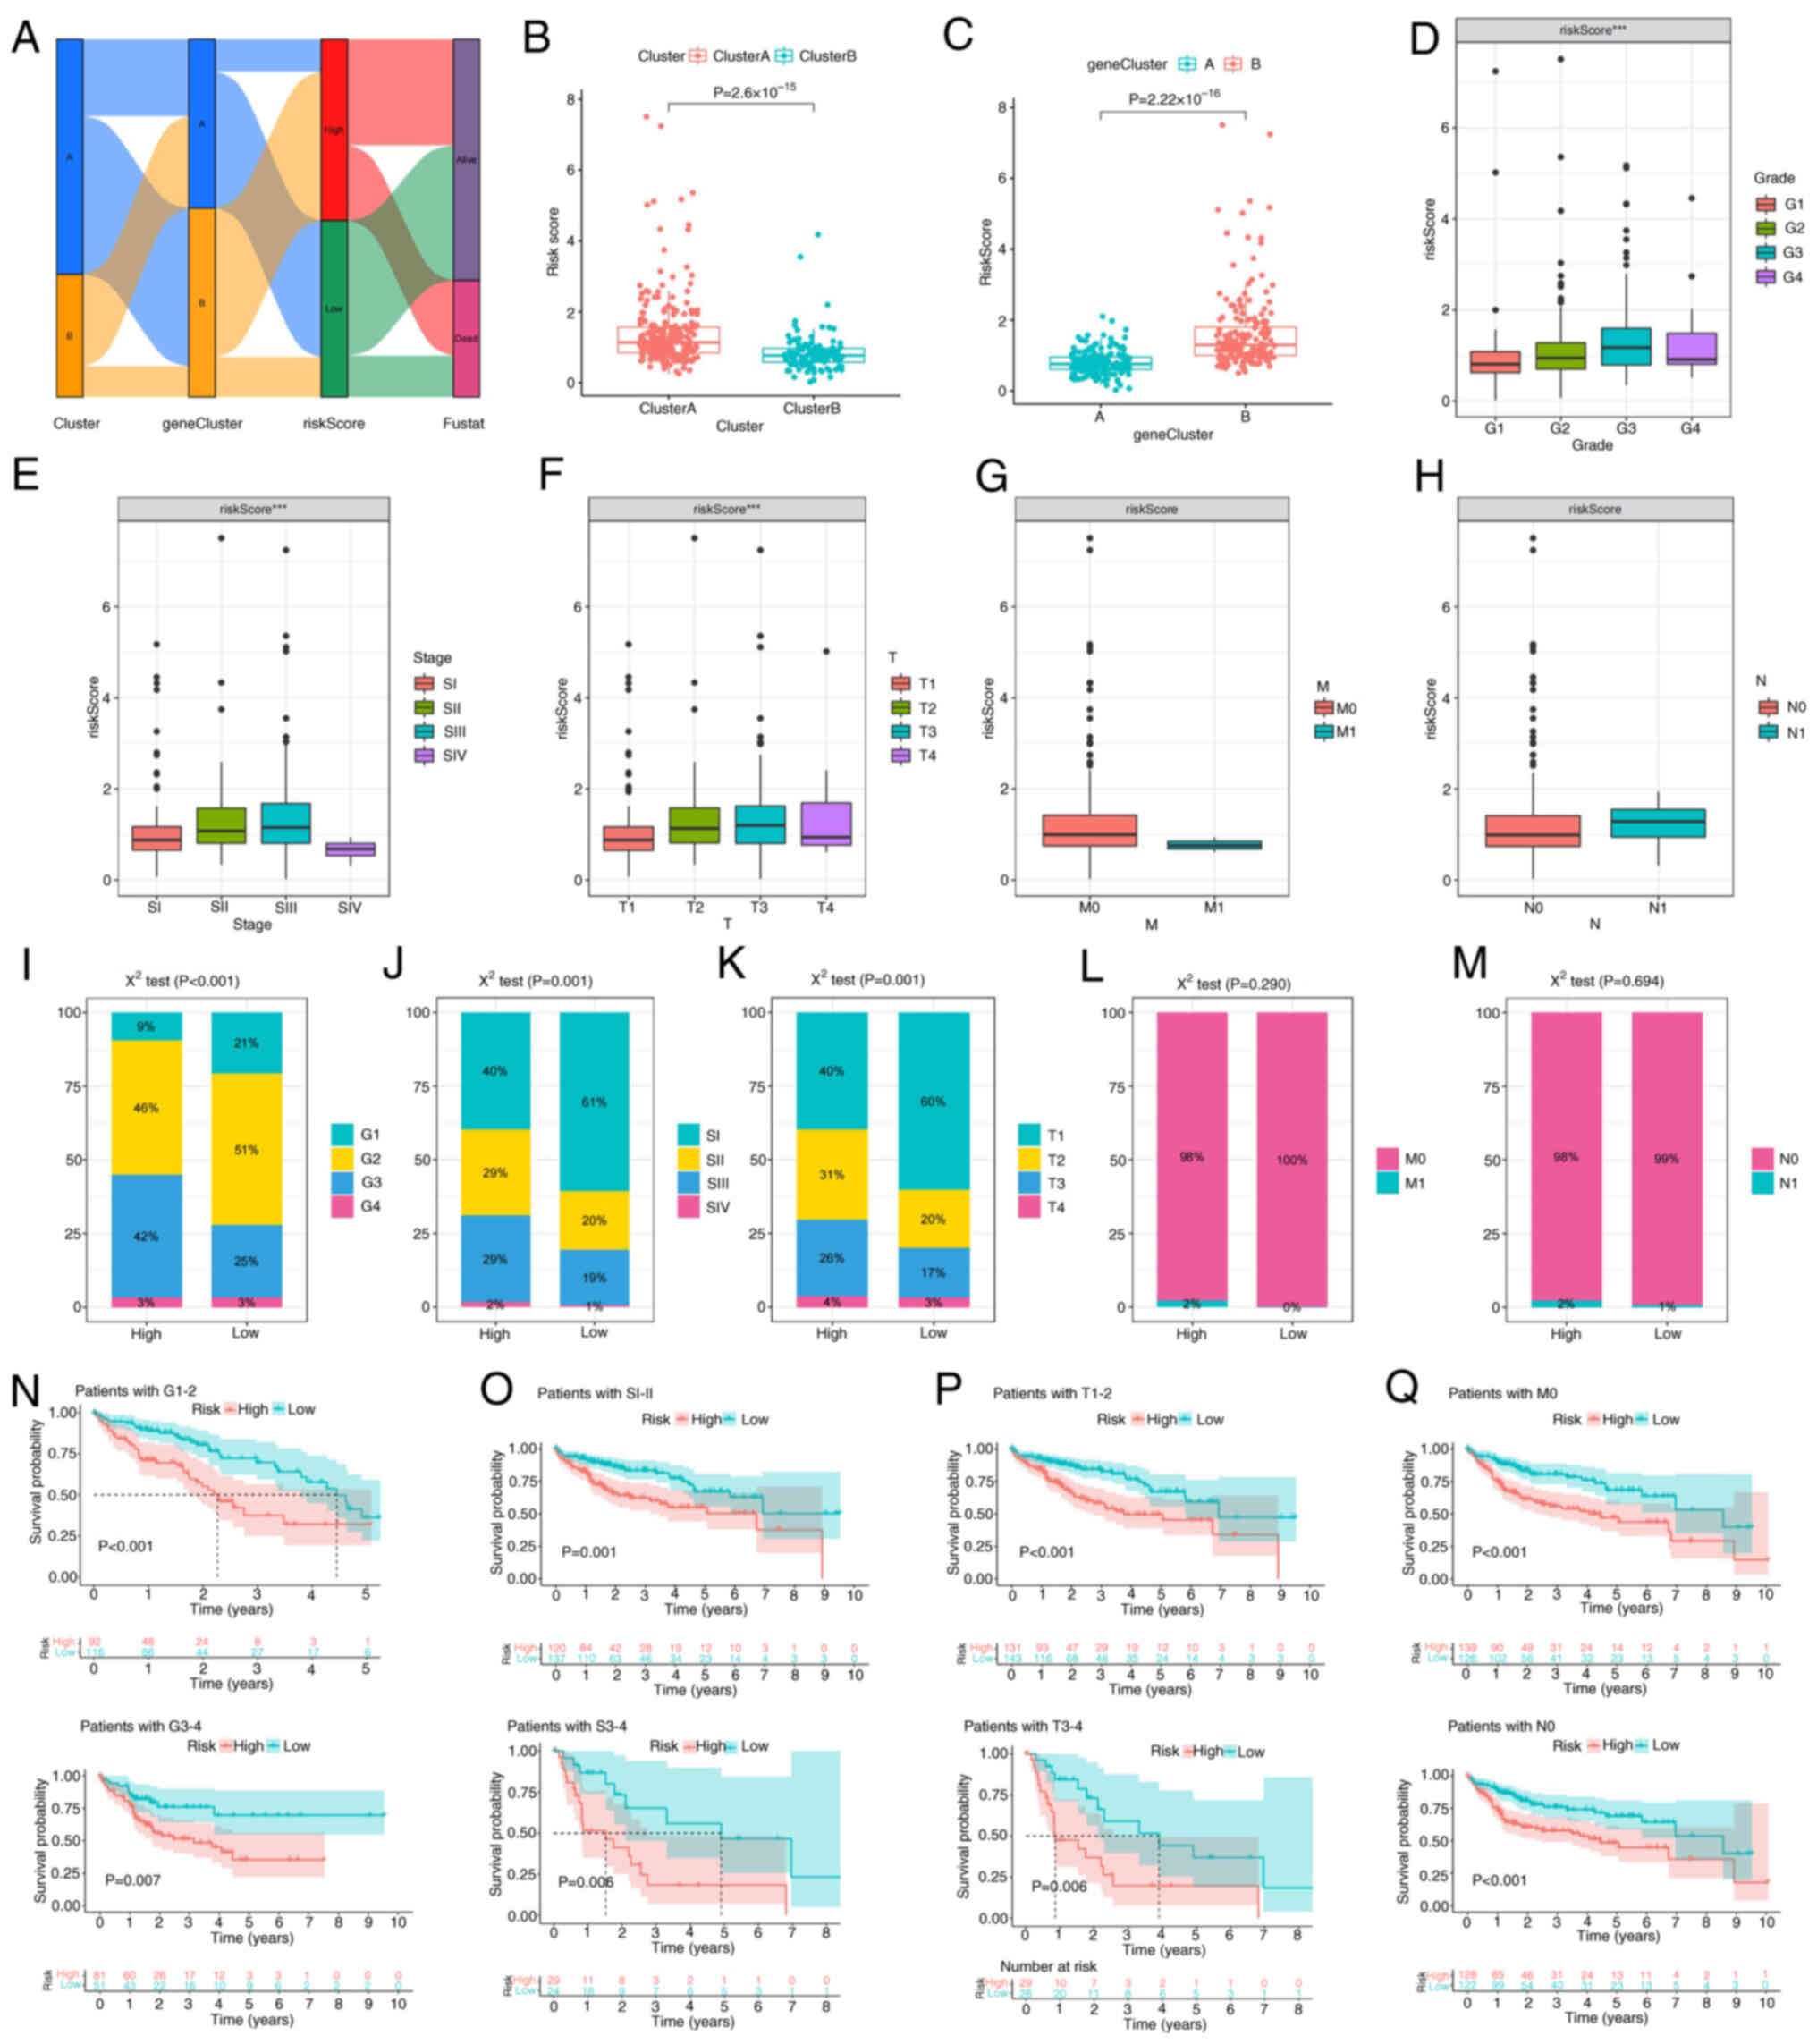
Consistent with the aforementioned results, the majority of the patients in cluster A were assigned to gene cluster B, which was associated with worse survival outcomes. The majority of patients in cluster B were assigned to gene Cluster A, which was associated with better survival outcomes (Fig. 5A). The risk scores are significantly higher in Cluster A compared to Cluster B (Fig. 5B). Conversely, the risk scores are significantly higher in gene Cluster B compared to gene Cluster A (Fig. 5C). Risk scores were significantly associated with histological grade, stage and T stage (Fig. 5D-H). The χ2 test was then applied to the aforementioned data; however, due to the small number of patients with M1 and lymph node (N)1 stage in TCGA cohort data, the results were not revealed to be significant (Fig. 5I-M). Moreover, to assess whether the GMS could be applied to patients in different clinical groups, KM curve analysis was used to analyze whether there were prognostic contrasts between high- and low-risk groups in different clinical groups. The results revealed that there were crucial statistical differences between the high- and low-risk groups in the G1-4, SI–IV, M0, N0 and T1-4 groups. Compared with the high-risk group, the low-risk group had a significant survival advantage (Fig. 5N-Q).
Mutation and drug-sensitivity of the GMS
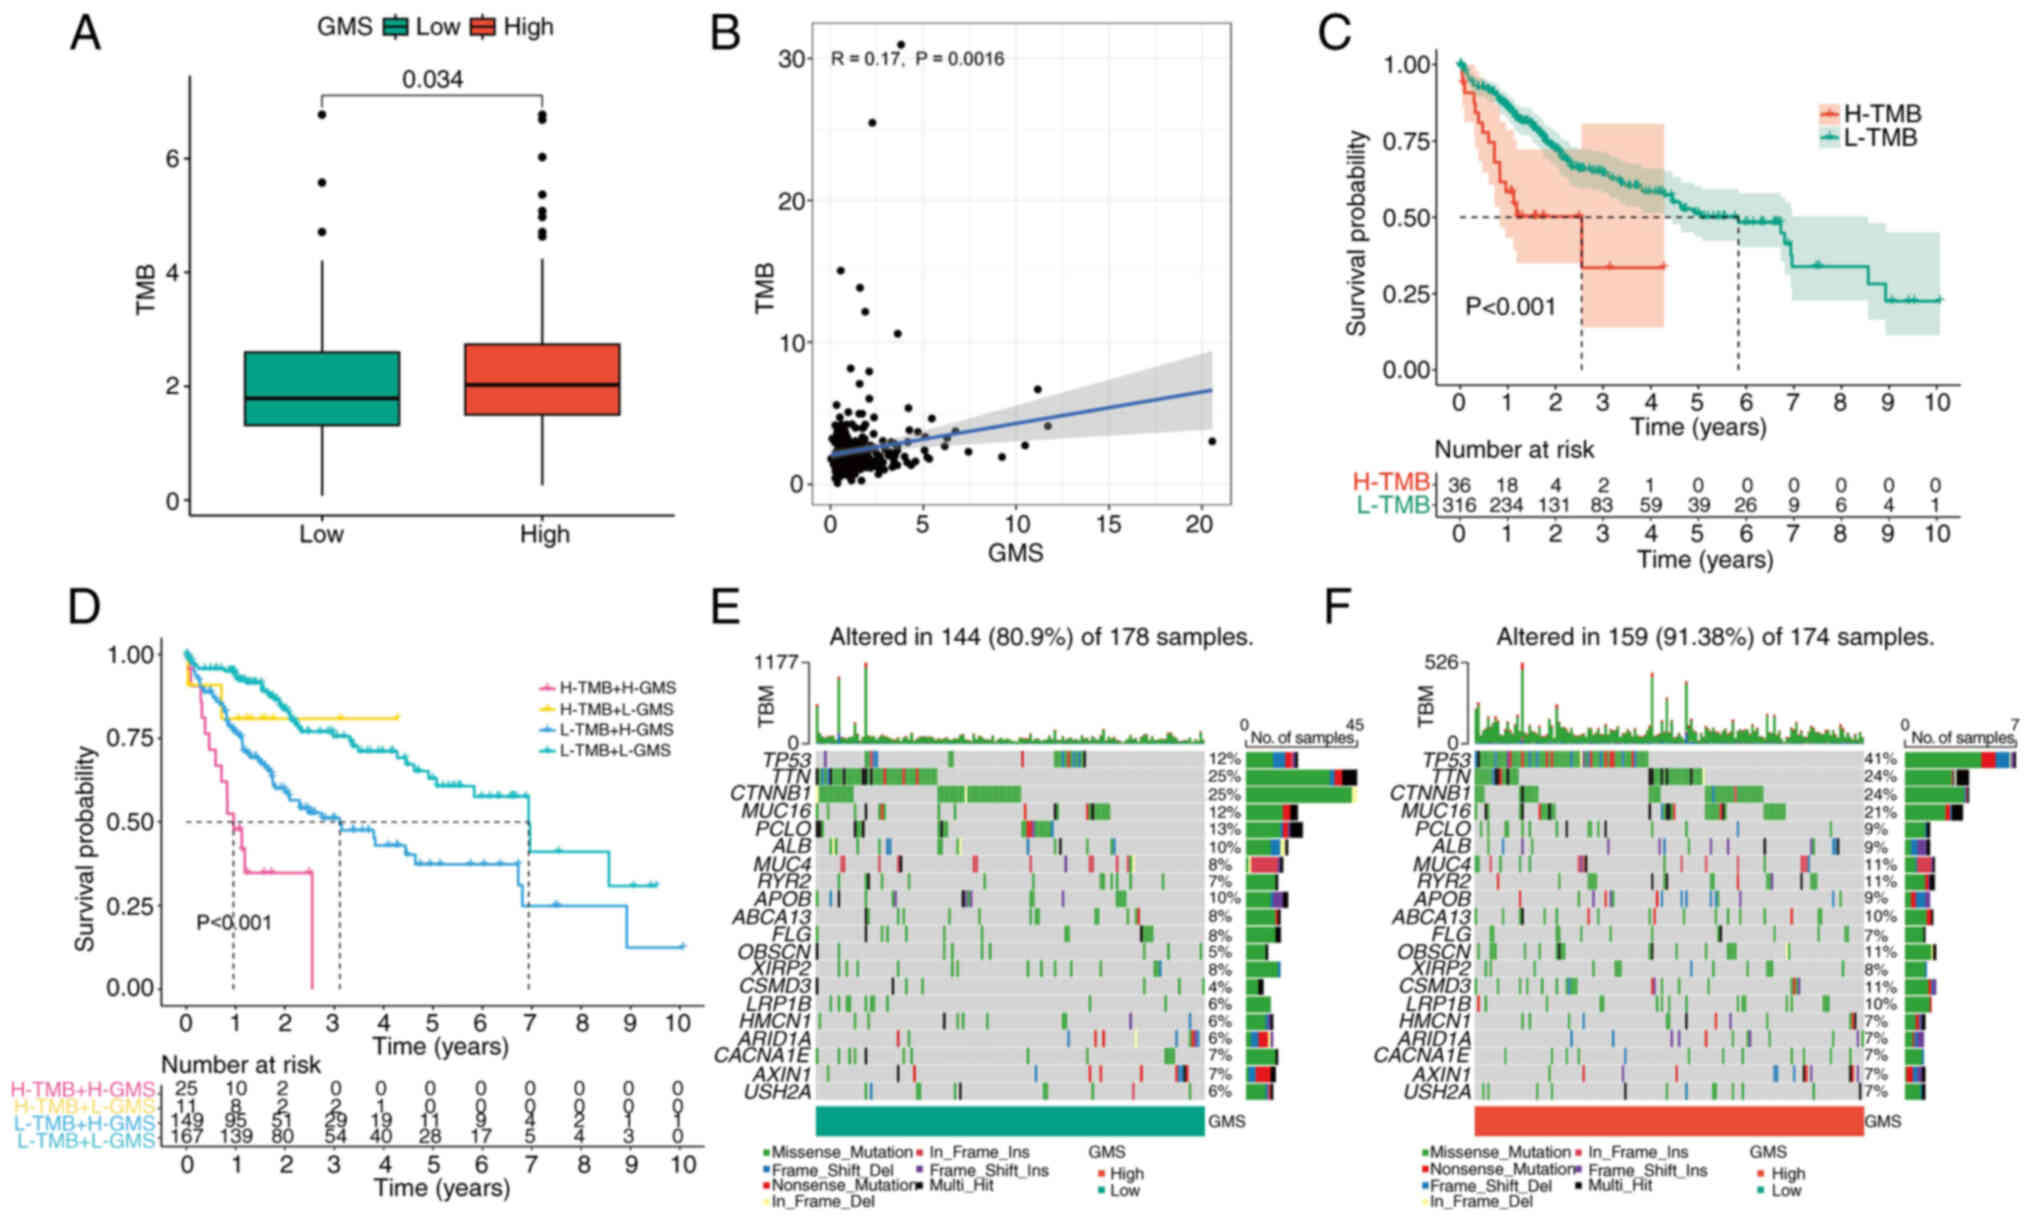
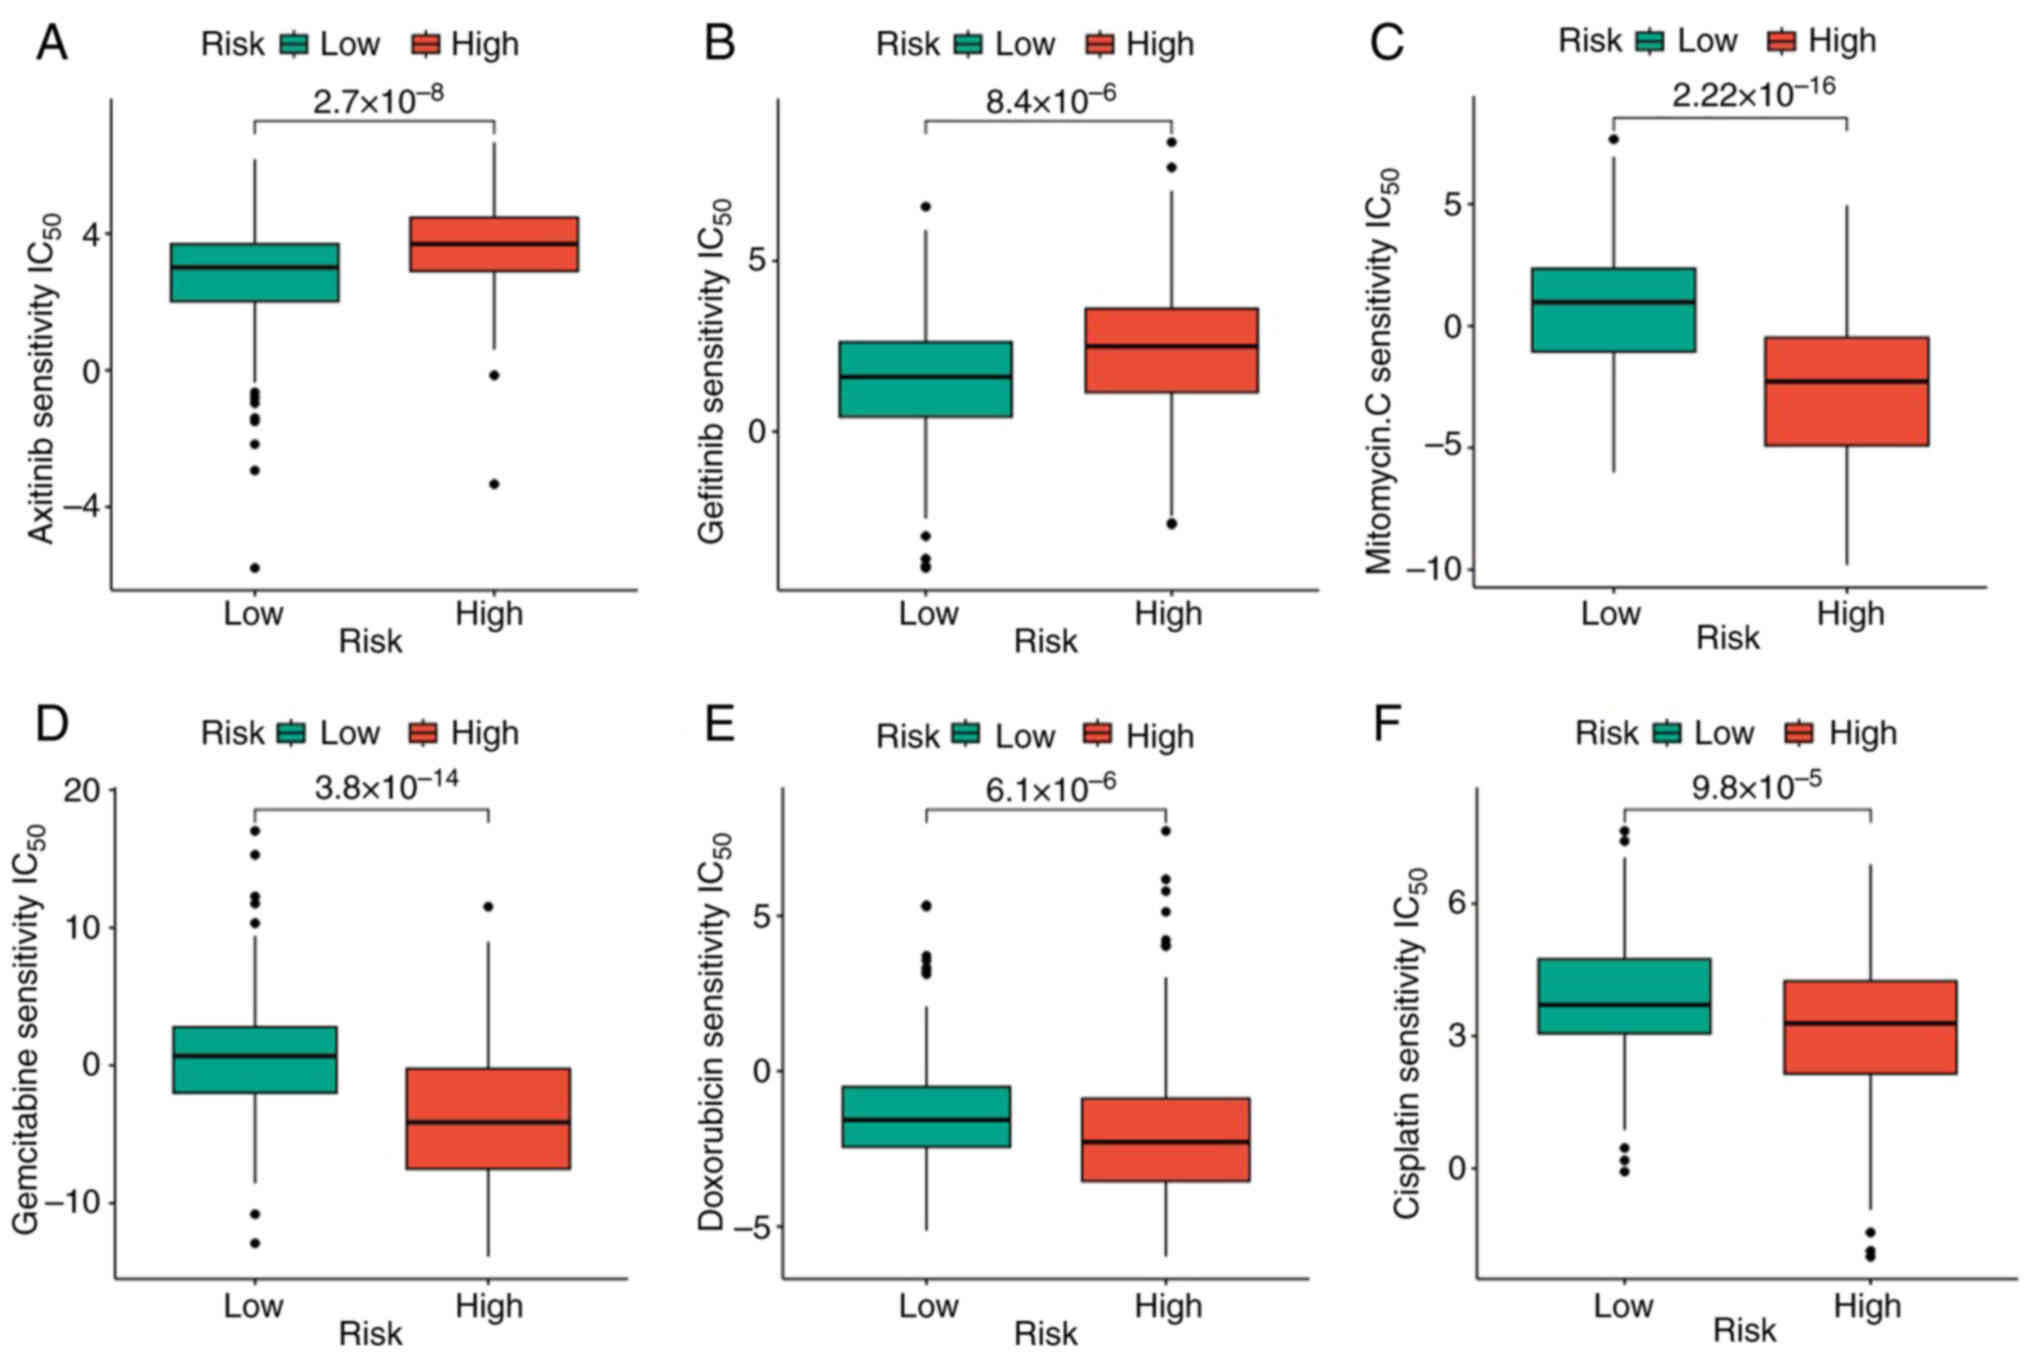
As the TMB was demonstrated to be significantly associated with the efficacy of immunotherapy, TMB changes in the high- and low-GMS groups were analyzed. The high GMS group had a significantly higher TMB than the low GMS group (Fig. 6A). Moreover, TMB was revealed to be significantly positively correlated with GMS (Fig. 6B). In addition, high TMB was significantly associated with poor prognosis (Fig. 6C). Subsequently, the value of combining GMS and TMB in predicting the prognosis of patients with LIHC was analyzed. The KM survival curve analysis revealed that patients with high TMB + high GMS had the worst prognosis, whereas those with low TMB + low GMS had the best prognosis (Fig. 6D). The mutation rate was 144/178 (80.9%) in the low GMS group and 159/174 (91.38%) in the high GMS group. The identical top 20 genes with mutation rates were identified in the high- and the low-GMS groups (Fig. 6E and F). Subsequently, the pRRophetic algorithm was used to predict the sensitivity to the six common antitumor drugs (namely, axitinib, cisplatin, doxorubicin, gefitinib, gemcitabine and mitomycin C), comparing between the high- and low-risk groups. Significantly lower sensitivity to axitinib and gemcitabine and significantly higher sensitivity to cisplatin, doxorubicin, gefitinib and mitomycin C were observed in the high-risk group compared with the low-risk group (Fig. 7). The results obtained may be used to guide subsequent clinical treatment decisions.
Identification of clinical and immune features of the modeled gene
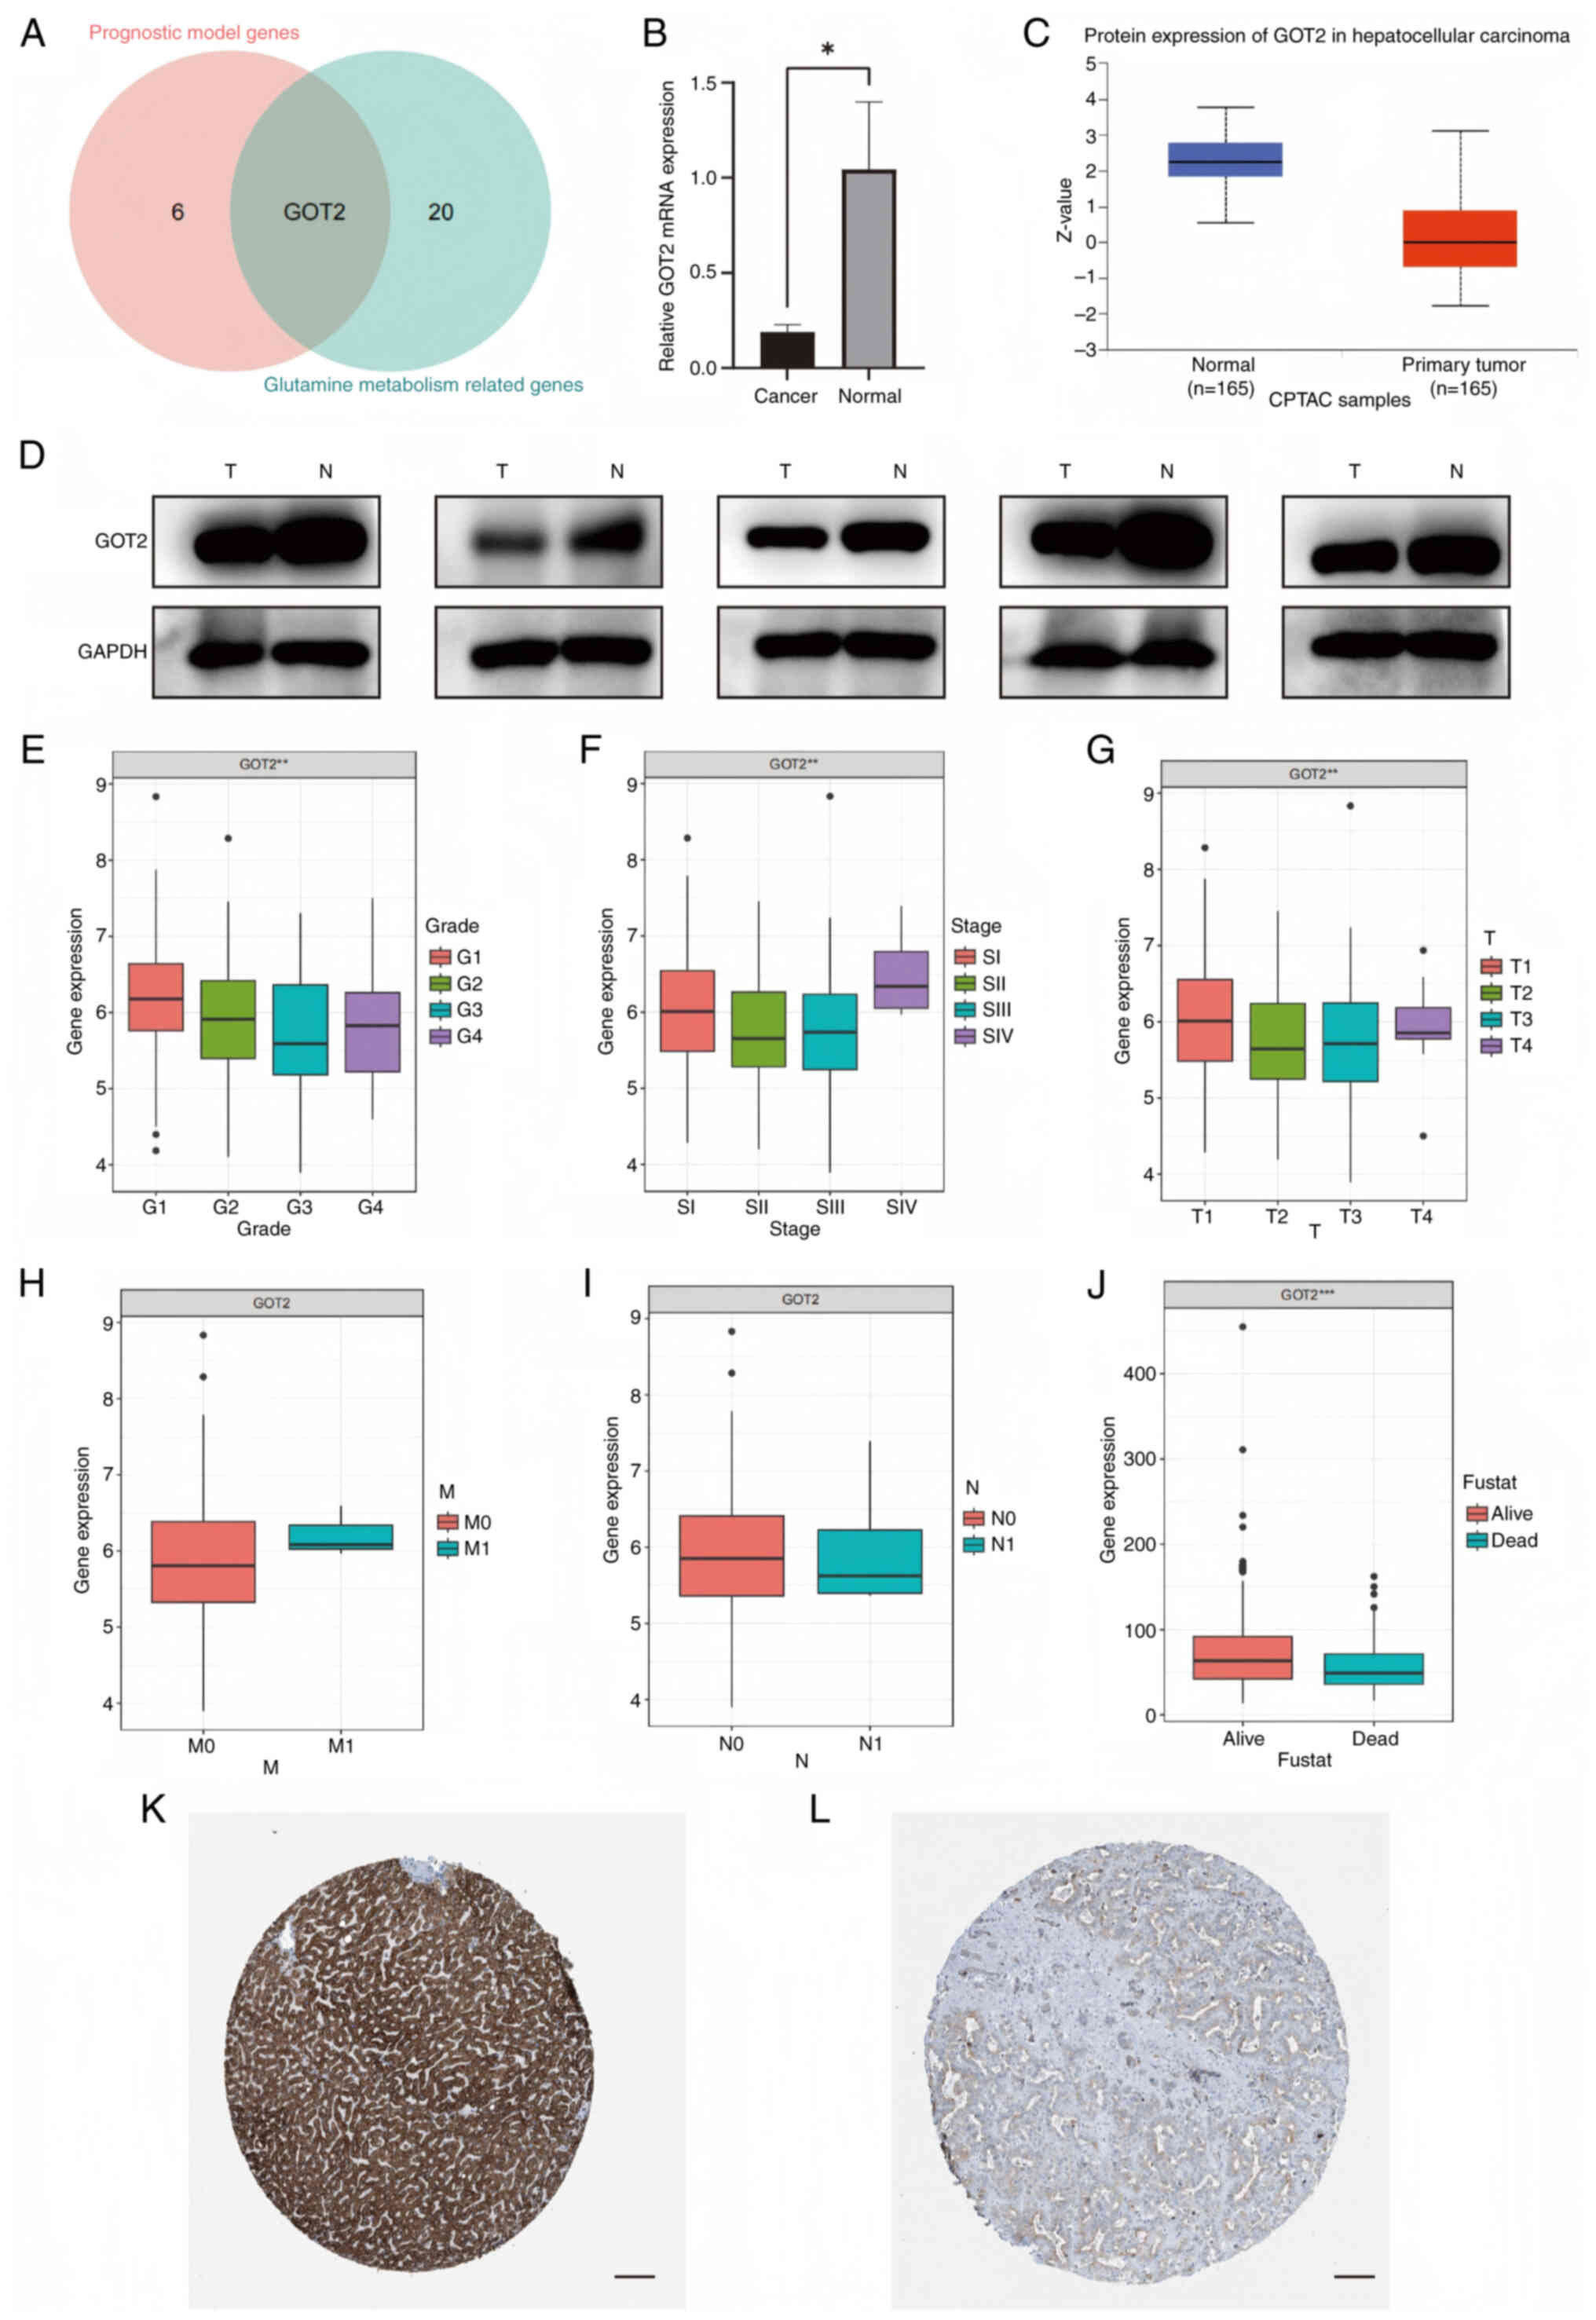
The present study demonstrated that the intersecting gene between the modeling genes and GMGs was GOT2. Consequently, a more in-depth analysis of the clinical features associated with GOT2 in LIHC was performed (Fig. 8A). RT-qPCR and western blotting were performed in LIHC and normal tissues to further validate differential expression of the modeled genes between cancer and paracancer tissues. GOT2 mRNA and protein expression was lower in LIHC compared to normal tissues (Fig. 8B and D). GOT2 expression was demonstrated to be significantly reduced in tumor tissues compared with in normal tissues in CPTAC samples (Fig. 8C). Moreover, a lower expression level of GOT2 was revealed to be correlated with more advanced and less differentiated tumors (Fig. 8E-J). In addition, data from the Human Protein Atlas database demonstrated that the expression levels of GOT2 were significantly lower in LIHC tissues compared with in normal liver tissues (Fig. 8K and L).
Knockdown of GOT2 significantly promotes cell proliferation and migration in LIHC
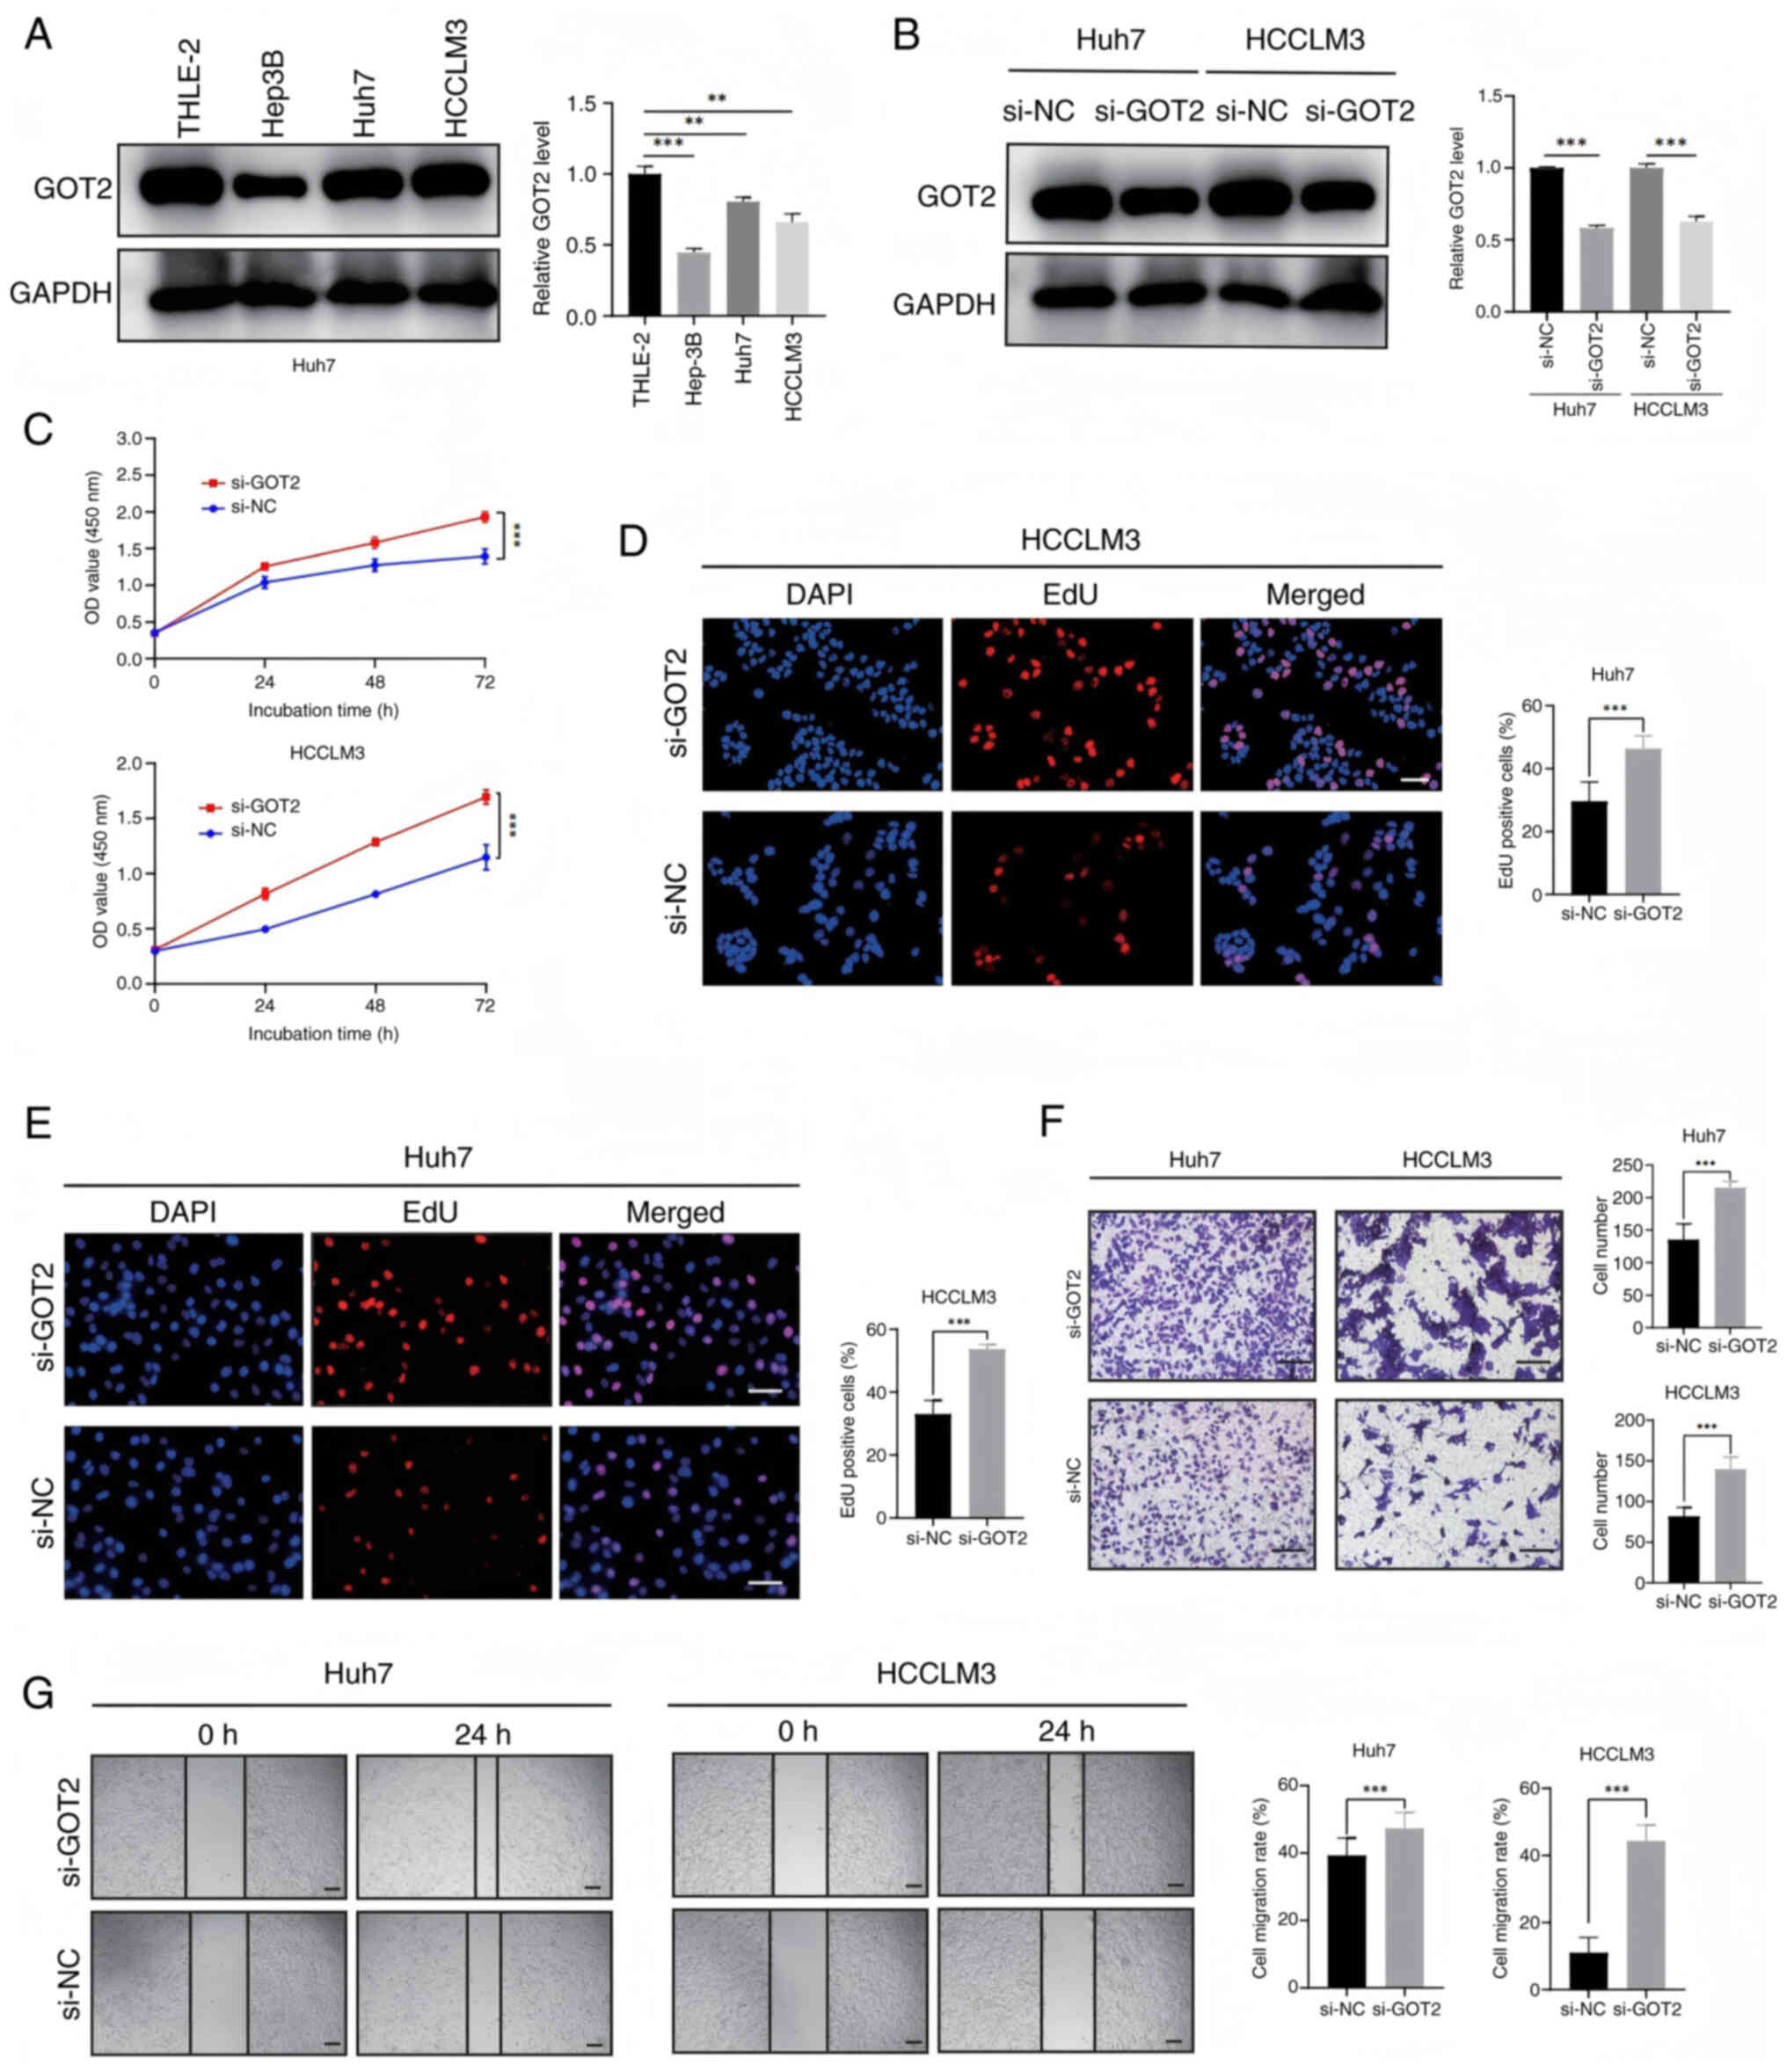
In light of the clinical data suggesting a possible involvement of GOT2 in the advancement of LIHC tumors, GOT2 expression was subsequently assessed in three different LIHC cell lines and the normal hepatocellular THLE-2 cell line using western blotting (Fig. 9A). The expression of GOT2 was revealed to be significantly higher in HCCLM3 and Huh7 cell lines compared with in THLE-2 and Hep3B cell lines. Consequently, HCCLM3 and Huh7 cell lines were utilized for siRNA-mediated knockdown studies. Western blot analysis assessed the effectiveness of GOT2-siRNA knockdown (Fig. 9B). Subsequently, CCK-8 and EdU tests were performed to evaluate cell viability. The findings obtained demonstrated that GOT2 knockdown was significantly associated with increased LIHC cell proliferation, in comparison with the negative controls (Fig. 9C-E). In addition, Transwell and wound healing assays revealed that cell migration was significantly increased following GOT2 knockdown, in comparison with the negative controls (Fig. 9F and G). Taken together, these findings suggest that GOT2 knockdown may boost LIHC migration and proliferation.
Discussion
HCC is a common malignancy and a leading cause of cancer death worldwide. The prognosis for HCC is poor worldwide. The estimated global incidence rate of liver cancer is 9.3 per 100,000 person-years, with a corresponding mortality rate of 8.5. (19). However, a wide range of treatment options are available for patients with LIHC, including liver transplantation, surgical resection, percutaneous ablation and radiation, as well as transarterial and systemic therapies. Moreover, the treatment ‘landscape’ for advanced LIHC is more diverse than ever, with the approval of new first- and second-line agents, and the establishment of immune checkpoint inhibitor-based therapies as standards of care. However, there remains an urgent need for the discovery of predictive biomarkers to guide treatment selection, and the optimal sequencing of drugs also remains to be defined (20).
Multiple pathways are known to regulate cancer cell anabolism and metabolism to provide energy to growing cells, enabling them to survive (21). The metabolic phenotype and metabolic dependency of neighboring mesenchymal and immune cells in the TME are reprogrammed during cancer progression from preneoplastic lesions to localized disease (22). Warburg (23,24) considered that tumor cell glucose metabolism switches from aerobic oxidation to glycolysis, thereby providing sufficient energy and necessary macromolecular precursors for tumor cell proliferation. During metabolic reprogramming, a hypoxic, acidic and nutrient-deficient TME is formed, thereby inhibiting the antitumor immune response (25,26). Amino acids are substrates for protein synthesis, and, following glucose, provide a major source of intracellular energy and nutrients. In addition to being substrates for protein synthesis, amino acids act as metabolites and metabolic regulators to support cancer cell growth (27,28). A plentiful supply of amino acids enables the cancer cells to continue to proliferate. Studying these amino acids should therefore open up new prospects for cancer diagnosis and treatment through providing insights into the molecular events underlying malignancy.
Glutamine, a non-essential amino acid, provides nitrogen and carbon for the synthesis of amino acids, lipids and nucleic acids. In tumor cells, glutamine depletion contributes carbon and ammonia to supplement the donor of α-ketoglutarate, an intermediate in the TCA cycle, and enhances the biosynthesis of nucleotides (29,30). The present study demonstrated that glutamine metabolism was an indispensable process in LIHC tumorigenesis, as 20/21 genes that regulate glutamine metabolism were revealed to be differentially expressed, comparing between the normal and LIHC samples. The present study defined two groups of LIHC patients with different clinical characteristics, biological characteristics and TME characteristics. In addition, the GMS was constructed based on three prognostic genes, which demonstrated notable prognostic value in different datasets. GMS was an independent prognostic indicator of patient survival. Furthermore, the sensitivity of six common antitumor drugs was revealed to vary between the high and low GMS groups, opening up broad prospects for its potential clinical applicability, such as in the case of optimizing personalized therapy. Therefore, GMS was not only to be an independent prognostic tool for predicting prognosis, but can be used as a potential predictor of drug sensitivity for LIHC therapy.
In addition to gene expression data from microarrays, sequence data, such as whole-genome sequencing (WGS) and RNA-seq, can provide deeper insights into the genetic and epigenetic alterations in LIHC. For example, WGS is able to reveal somatic mutations and structural variations in GMGs, whereas RNA-seq can offer a more precise quantification of gene expression levels and alternative splicing events (31). Recent studies have demonstrated the utility of sequence data in identifying key driver mutations and regulatory elements in cancer genomes (for example, EpITEAmDNA and DeepSF-4mC) (32,33). Integrating sequence data with the findings of the present study could further elucidate the role of glutamine metabolism in LIHC progression, and also identify potential targets for precision medicine.
Moreover, DNA epigenetic modifications, such as methylation, are crucial regulators of gene expression and have been implicated in cancer development (34). Recent studies, such as EpITEAmDNA and DeepSF-4mC, have demonstrated the power of deep learning models in predicting DNA methylation sites and other epigenetic modifications (32). These tools can be applied to LIHC to investigate the methylation status of glutamine metabolism-associated genes, such as GOT2, and their impact on gene expression. Additionally, frameworks such as GSRNet, which combine multi-scale convolutional neural networks and bidirectional gated recurrent units, can be used to predict genomic signals and regions associated with LIHC progression. Integrating these approaches with the findings of the present study could provide a more comprehensive understanding of the epigenetic regulation of glutamine metabolism in LIHC (33).
Protein post-translational modifications (PTMs), such as lysine acetylation, exert critical roles in regulating protein function and cellular signaling pathways. Advances in computational methods, such as SIPSC-Kac, have markedly improved the identification of lysine acetylation sites by integrating swarm intelligence and protein spatial characteristics. In the context of LIHC, PTMs of glutamine metabolism-related proteins, such as GOT2, may influence their enzymatic activity and interaction networks. Future studies could leverage these computational tools to explore the acetylation status of GOT2 and other key proteins in LIHC, potentially uncovering novel regulatory mechanisms and therapeutic targets (35). Futhermore, enhancers are critical regulatory elements that control gene expression through interacting with promoters and other regulatory regions. Recent computational methods, such as the W2V-repeated index, have improved the prediction of enhancers and their strength, based on repeated DNA fragments. In the context of LIHC, enhancer sequences may fulfill a key role in regulating the expression of GMGs, such as GOT2. Future studies could explore the enhancer landscape of LIHC to identify potential regulatory elements that drive the dysregulation of glutamine metabolism. Understanding these regulatory mechanisms may also provide novel insights into LIHC pathogenesis, and reveal novel therapeutic targets (36).
Previous studies have identified a specific nutrient-partitioning mechanism in the TME: Immune cells preferentially consume glucose, whereas tumor cells consume glutamine (37). Consequently, glutamine uptake and catabolism are notably enhanced in several types of tumor cells (38). Glutamine supplementation promotes the proliferation, invasion and metastasis of tumor cells (39). Moreover, Leone et al (40) reported that glutamine blockade suppresses cancer cell metabolism and enhances the antitumor immune response. The present study demonstrated that the GOT2 gene, which regulates glutamine metabolism, was closely associated with patient prognosis. Through database analysis, it was revealed that the expression of GOT2 in LIHC tissues was significantly lower compared with that in the adjacent normal tissues. Moreover, immunohistochemical results demonstrated that the expression level of GOT2 in LIHC tissues was significantly lower than that in normal control tissues. The expression of GOT2 was also demonstrated to be significantly associated with the T, N stage and M stage of the tumor, suggesting that GOT2 may be involved in the progression of LIHC, and the expression level of GOT2 may be an effective marker to assess the development of cancer. The GOT2 gene may also be a potential tumor suppressor gene in LIHC. The expression of GOT2 was closely associated with the occurrence, development and prognosis of LIHC in patients, and this is expected to become an important potential biomarker. Therefore, it is necessary to further study the mechanism and function of this gene in LIHC, so as to provide a stronger basis for comprehensively understanding both the role of GOT2 in tumor progression and its significance in the prevention and diagnosis of LIHC.
Furthermore, Ren et al (41) identified metabolism-related genes that are closely associated with HCC tumorigenesis and prognosis through a multi-cohort dataset and comprehensive bioinformatics analyses. By contrast, the present study focused on glutamine metabolism-related genes in HCC and constructed a predictive model of the GMS. The model in the present study was able to provide a more accurate prognosis and drug sensitivity assessment, determine the disease trend of the patient, and assist in formulating clinical medications. In the field of drug development, the model could be used as a screening tool to help researchers identify patient groups that are likely to respond well to specific therapeutic drugs. However, there are certain limitations that need to be resolved before the model can be applied in practice. The accuracy of the model relies on a large amount of high-quality data, and the current data may suffer from an insufficient sample size and a single source of data, which may lead to the model having only limited generalization potential. Glutamine metabolism also involves multiple complex biological processes, and so the model may not be able to fully cover all the influencing factors, such as interactions with other metabolic pathways and the influence of the TME, which may affect the reliability of the model prediction. Moreover, the aforementioned results were based on bioinformatic mining of TCGA and ICGC databases, which represent a retrospective validation of the research results of the present study. Therefore, prospective studies are essential to evaluate the clinical efficacy of patients with LIHC.
In conclusion, the present study revealed that GMGs exert an important role in the development and prognoses of LIHC. The GMS was demonstrated to be efficient in predicting the survival of patients with LIHC. Moreover, GOT2 may be involved in the occurrence and development of LIHC, and therefore this gene has the potential to be used as a prognostic indicator for targeted therapeutic interventions.
Acknowledgements
Not applicable.
Funding
Funding: No funding was received.
Availability of data and materials
The data generated in the present study may be requested from the corresponding author.
Authors' contributions
XH, RW and MS conceived the study and wrote the manuscript. XH and RW performed the experiments. XH, YHZ, YZ and XC analyzed the data. YZ and MS confirm the authenticity of all the raw data. All authors have read and approved the final manuscript.
Ethics approval and consent to participate
The present study was approved by the Ethics Committee of Yixing Branch of Wuxi Medical Center of Nanjing Medical University (approval no. 050-01) and written informed consent was obtained from the patients.
Patient consent for publication
Not applicable.
Competing interests
The authors declare that they have no competing interests.
References
|
World Health Organization, . International Agency for Research on Cancer. Global Cancer Observatory: Cancer Today. IARC; Lyon: 2022, Available from:. https://gco.iarc.fr/today | |
|
Zhong C, Xiong G, Yang H, Du X, Du J, Yao F, Fang W and Deng Y: Phosphorylation by IKKβ promotes the degradation of HMGCL via NEDD4 in lung cancer. Int J Biol Sci. 19:1110–1122. 2023. View Article : Google Scholar : PubMed/NCBI | |
|
Altman BJ, Stine ZE and Dang CV: From krebs to clinic: Glutamine metabolism to cancer therapy. Nat Rev Cancer. 16:619–634. 2016. View Article : Google Scholar : PubMed/NCBI | |
|
Ge T, Gu X, Jia R, Ge S, Chai P, Zhuang A and Fan X: Crosstalk between metabolic reprogramming and epigenetics in cancer: Updates on mechanisms and therapeutic opportunities. Cancer Commun (Lond). 42:1049–1082. 2022. View Article : Google Scholar : PubMed/NCBI | |
|
Zhang Z, Huang Y, Li S and Hong L: Comprehensive analysis based on glycolytic and glutaminolytic pathways signature for predicting prognosis and immunotherapy in ovarian cancer. J Cancer. 15:383–400. 2024. View Article : Google Scholar : PubMed/NCBI | |
|
Zhang HL, Chen P, Yan HX, Fu GB, Luo FF, Zhang J, Zhao SM, Zhai B, Yu JH, Chen L, et al: Targeting mTORC2/HDAC3 inhibits stemness of liver cancer cells against glutamine starvation. Adv Sci (Weinh). 9:e21038872022. View Article : Google Scholar : PubMed/NCBI | |
|
Li S, Xu L, Wu G, Huang Z, Huang L, Zhang F, Wei C, Shen Q, Li R, Zhang L and Xu X: Remodeling serine synthesis and metabolism via nanoparticles (NPs)-mediated CFL1 silencing to enhance the sensitivity of hepatocellular carcinoma to sorafenib. Adv Sci (Weinh). 10:e22071182023. View Article : Google Scholar : PubMed/NCBI | |
|
Park JM, Peng JM, Shen YS, Lin CY, Hsu TW, Su YH, Chen HA, Saengboonmee C, Chang JS, Chiu CF, et al: Phosphomimetic dicer S1016E triggers a switch to glutamine metabolism in gemcitabine-resistant pancreatic cancer. Mol Metab. 65:1015762022. View Article : Google Scholar : PubMed/NCBI | |
|
He J, Chen Z, Xue Q, Sun P, Wang Y, Zhu C and Shi W: Identification of molecular subtypes and a novel prognostic model of diffuse large B-cell lymphoma based on a metabolism-associated gene signature. J Transl Med. 20:1862022. View Article : Google Scholar : PubMed/NCBI | |
|
Yu Z, Li J, Ren Z, Sun R, Zhou Y, Zhang Q, Wang Q, Cui G, Li J, Li A, et al: Switching from fatty acid oxidation to glycolysis improves the outcome of acute-on-chronic liver failure. Adv Sci (Weinh). 7:19029962020. View Article : Google Scholar : PubMed/NCBI | |
|
Huang M, Xiong D, Pan J, Zhang Q, Sei S, Shoemaker RH, Lubet RA, Montuenga LM, Wang Y, Slusher BS and You M: Targeting glutamine metabolism to enhance immunoprevention of EGFR-Driven lung cancer. Adv Sci (Weinh). 9:e21058852022. View Article : Google Scholar : PubMed/NCBI | |
|
Curthoys NP and Watford M: Regulation of glutaminase activity and glutamine metabolism. Annu Rev Nutr. 15:133–159. 1995. View Article : Google Scholar : PubMed/NCBI | |
|
GTEx Consortium: Human genomics. The genotype-tissue expression (GTEx) pilot analysis: Multitissue gene regulation in humans. Science. 348:648–660. 2015. View Article : Google Scholar : PubMed/NCBI | |
|
Nishikawa G, Kawada K, Hanada K, Maekawa H, Itatani Y, Miyoshi H, Taketo MM and Obama K: Targeting asparagine synthetase in tumorgenicity using patient-derived tumor-initiating cells. Cells. 11:32732022. View Article : Google Scholar : PubMed/NCBI | |
|
Yao Z, Zhu G, Too J, Duan M and Wang Z: Feature selection of OMIC data by ensemble swarm intelligence based approaches. Front Genet. 12:7936292021. View Article : Google Scholar : PubMed/NCBI | |
|
Wang H, Yao Z, Luo R, Liu J, Wang Z and Zhang G: LaCOme: Learning the latent convolutional patterns among transcriptomic features to improve classifications. Gene. 862:1472462023. View Article : Google Scholar : PubMed/NCBI | |
|
Liu X, Wan J, Wei M, Tong Y and Yao Z: Edaravone protects trophoblast cells from hypoxic injury in preeclampsia: Inhibition of the PI3K/AKT pathway as a promising therapeutic approach. Immun Inflamm Dis. 12:e700972024. View Article : Google Scholar : PubMed/NCBI | |
|
Harshitha R and Arunraj DR: Real-time quantitative PCR: A tool for absolute and relative quantification. Biochem Mol Biol Educ. 49:800–812. 2021. View Article : Google Scholar : PubMed/NCBI | |
|
McGlynn KA, Petrick JL and El-Serag HB: Epidemiology of hepatocellular carcinoma. Hepatology. 73 (Suppl 1):S4–S13. 2021. View Article : Google Scholar | |
|
Vogel A, Meyer T, Sapisochin G, Salem R and Saborowski A: Hepatocellular carcinoma. Lancet. 400:1345–1362. 2022. View Article : Google Scholar : PubMed/NCBI | |
|
Pavlova NN and Thompson CB: The emerging hallmarks of cancer metabolism. Cell Metab. 23:27–47. 2016. View Article : Google Scholar : PubMed/NCBI | |
|
Fonseca LMD, Diniz-Lima I, da Costa Santos MAR, Franklim TN, da Costa KM, Santos ACD, Morrot A, Decote-Ricardo D, Valente RDC, Freire-de-Lima CG, et al: Bittersweet sugars: How unusual glycan structures may connect epithelial-to-mesenchymal transition and multidrug resistance in cancer. Medicines (Basel). 10:362023.PubMed/NCBI | |
|
Warburg O: On the origin of cancer cells. Science. 123:309–314. 1956. View Article : Google Scholar : PubMed/NCBI | |
|
Warburg O: On respiratory impairment in cancer cells. Science. 124:269–270. 1956. View Article : Google Scholar : PubMed/NCBI | |
|
Kouidhi S, Ayed FB and Elgaaied AB: Targeting tumor metabolism: A new challenge to improve immunotherapy. Front Immunol. 9:3532018. View Article : Google Scholar : PubMed/NCBI | |
|
Zhao E, Maj T, Kryczek I, Li W, Wu K, Zhao L, Wei S, Crespo J, Wan S, Vatan L, et al: Cancer mediates effector T cell dysfunction by targeting microRNAs and EZH2 via glycolysis restriction. Nat Immunol. 17:95–103. 2016. View Article : Google Scholar : PubMed/NCBI | |
|
Tsun ZY and Possemato R: Amino acid management in cancer. Semin Cell Dev Biol. 43:22–32. 2015. View Article : Google Scholar : PubMed/NCBI | |
|
Sivanand S and Heiden MG: Emerging roles for branched-chain amino acid metabolism in cancer. Cancer Cell. 37:147–156. 2020. View Article : Google Scholar : PubMed/NCBI | |
|
Krall AS and Christofk HR: Rethinking glutamine addiction. Nat Cell Biol. 17:1515–1517. 2015. View Article : Google Scholar : PubMed/NCBI | |
|
Fernandez-de-Cossio-Diaz J and Vazquez A: Limits of aerobic metabolism in cancer cells. Sci Rep. 7:134882017. View Article : Google Scholar : PubMed/NCBI | |
|
Nakagawa H and Fujita M: Whole genome sequencing analysis for cancer genomics and precision medicine. Cancer Sci. 109:513–522. 2018. View Article : Google Scholar : PubMed/NCBI | |
|
Li F, Liu S, Li K, Zhang Y, Duan M, Yao Z, Zhu G, Guo Y, Wang Y, Huang L and Zhou F: EpiTEAmDNA: Sequence feature representation via transfer learning and ensemble learning for identifying multiple DNA epigenetic modification types across species. Comput Biol Med. 160:1070302023. View Article : Google Scholar : PubMed/NCBI | |
|
Yao Z, Li F, Xie W, Chen J, Wu J, Zhan Y, Wu X, Wang Z and Zhang G: DeepSF-4mC: A deep learning model for predicting DNA cytosine 4mC methylation sites leveraging sequence features. Comput Biol Med. 171:1081662024. View Article : Google Scholar : PubMed/NCBI | |
|
Sun L, Zhang H and Gao P: Metabolic reprogramming and epigenetic modifications on the path to cancer. Protein Cell. 13:877–919. 2022. View Article : Google Scholar : PubMed/NCBI | |
|
Yao Z, Shangguan H, Xie W, Liu J, He S, Huang H, Li F, Chen J, Zhan Y, Wu X, et al: SIPSC-Kac: Integrating swarm intelligence and protein spatial characteristics for enhanced lysine acetylation site identification. Int J Biol Macromol. 282:1372372024. View Article : Google Scholar : PubMed/NCBI | |
|
Xie W, Yao Z, Yuan Y, Too J, Li F, Wang H, Zhan Y, Wu X, Wang Z and Zhang G: W2V-repeated index: Prediction of enhancers and their strength based on repeated fragments. Genomics. 116:1109062024. View Article : Google Scholar : PubMed/NCBI | |
|
Reinfeld BI, Madden MZ, Wolf MM, Chytil A, Bader JE, Patterson AR, Sugiura A, Cohen AS, Ali A, Do BT, et al: Cell-programmed nutrient partitioning in the tumour microenvironment. Nature. 593:282–288. 2021. View Article : Google Scholar : PubMed/NCBI | |
|
Jin J, Byun JK, Choi YK and Park KG: Targeting glutamine metabolism as a therapeutic strategy for cancer. Exp Mol Med. 55:706–715. 2023. View Article : Google Scholar : PubMed/NCBI | |
|
Zhang J, Pavlova NN and Thompson CB: Cancer cell metabolism: The essential role of the nonessential amino acid, glutamine. EMBO J. 36:1302–1315. 2017. View Article : Google Scholar : PubMed/NCBI | |
|
Leone RD, Zhao L, Englert JM, Sun IM, Oh MH, Sun IH, Oh MH, Sun IH, Arwood ML, Bettencourt IA, et al: Glutamine blockade induces divergent metabolic programs to overcome tumor immune evasion. Science. 366:1013–1021. 2019. View Article : Google Scholar : PubMed/NCBI | |
|
Ren H, Li W, Liu X, Li S, Guo H, Wang W and Zhao N: Identification and validation of an 6-metabolism-related gene signature and its correlation with immune checkpoint in hepatocellular carcinoma. Front Oncol. 11:7839342021. View Article : Google Scholar : PubMed/NCBI |