BLID is a drug-responsive target of FOXO3a and multi-omics analysis reveals survival mechanisms and therapeutic vulnerabilities in BLID-deficient breast cancer cells
- Authors:
- Published online on: June 24, 2025 https://doi.org/10.3892/ol.2025.15155
- Article Number: 409
-
Copyright: © Yadavalli et al. This is an open access article distributed under the terms of Creative Commons Attribution License.
Abstract
Introduction
Despite significant advances in various combinations of endocrine therapy, targeted therapy, chemotherapy and/or immunotherapy, clinical management of advanced breast cancer remains a challenge, in part, due to spatial and temporal expansion of therapy-resistant tumor cells, treatment-related adverse events and disease progression (1–3). Currently, breast cancer treatment strategies are largely guided by the expression status of estrogen receptor (ER), progesterone receptor (PR), and human epidermal growth factor receptor 2 (HER2). Unfortunately, patients with late-stage hormone receptor-positive and HER2-negative breast cancer, and triple-negative breast cancer (TNBC, ER-/PR-/HER2-) remain at high risk of disease recurrence (4,5). To improve precision cancer biology-driven clinical care of an aggressive disease, integrative multi-omics approaches have helped define genome-wide molecular heterogeneity and biomarkers of therapy resistance, and prioritize actionable therapeutic targets (6–8). Further discoveries of new mechanisms of drug-sensitivity/resistance and gain-of-function ‘turned’ oncogenic dependencies are critical for the development of multi-pronged interventions in the management of advanced stage disease.
The forkhead box protein O (FOXO) subfamily of transcriptional regulators is associated with breast cancer development and progression (2). Depending on the cellular context, FOXO proteins exhibit redundant and diverse functions, necessitating the identification of downstream effectors as potentially robust predictive biomarkers and targets for drug discovery. As a stress sensor and a prominent apoptotic transcription factor, FOXO3a (aliases FOXO3, FKHRL1) is activated in response to chemotherapeutic drugs and enhances chemosensitivity (2,9,10). FOXO3a has been associated with improved efficacies of the endocrine and targeted therapies of breast cancer (11–14). The downstream effectors and mechanisms by which FOXO3a promotes drug sensitivity in breast cancer cells remain to be elucidated.
BLID (alias BRCC2), BH-3 Like motif containing Inducer of cell Death, belongs to the category of novel and essential de novo protein-coding genes originating via positive selection (15). BLID is a strong prognostic factor in invasive breast cancer (16,17). Frequent loss of the BLID gene has also been reported in early-onset breast cancer (18,19). In addition, loss of BLID has been correlated with the progression of intraductal hyperplasia to ductal carcinoma in situ (20). Functionally, BLID has been shown to sequester BCL-XL and activate caspase-dependent mitochondrial pathway of apoptotic cell death (17). Other cytogenetic and in vitro and in vivo studies suggest that BLID is a breast tumor suppressor (18–21). The mechanism of regulation and the genome-wide influence of BLID are unclear. The present study focused on: 1) The role of FOXO3a as a novel BLID transcription factor, 2) the relationship between BLID expression and the cytotoxicity of chemotherapeutic drugs, and 3) multi-omics-guided identification of BLID effectors in breast cancer cells. The results revealed the drug resistance phenotype, the survival and proliferation dependencies, and tractable targets in BLID-deficient breast cancer cells. These data also highlighted the potential significance of BLID in drug metabolism and interferon-responsive signaling in breast cancer cells.
Materials and methods
Cell lines, antibodies and drugs
Human breast cancer cell lines T47D, MDA-MB-231, MDA-MB-468, LCC9, and SKBr3 were obtained from the Tissue Culture Shared Resource (TCSR) of the Georgetown Lombardi Comprehensive Cancer Center which also performed the cell line authentication and mycoplasma testing. Cells were cultured in DMEM with Glutamax, 10% heat inactivated FBS (Invitrogen; Thermo Fisher Scientific, Inc.) in a humidified incubator with 5% CO2 air. MCF-7 cells (ATCC) were cultured in DMEM supplemented with 10% FBS and 2 mmol/l glutamine.
The custom anti-BLID antibody used in the present study was developed as previously described (16,17). The c-IAP2 (58C7) antibody (cat. no. 3130), c-IAP1 (D5G9) antibody (cat. no. 7065) and XIAP (D2Z8W) antibody (cat. no. 14334) were obtained from Cell Signaling Technology, Inc. The DFNA5-N-terminal antibody (cat. no. ab175614) and DFNA5-C-terminal antibody (cat. no. ab221843) were obtained from Abcam. Drugs were obtained from Sigma-Aldrich and Selleck Chemicals. Doxorubicin (DXR), 5-fluorouracil (5-FU), cisplatin (Cis), and etoposide (ETO) were reconstituted in DMSO, whereas paclitaxel (PTX) and docetaxel (DTX) were formulated in 100% ethanol (EtOH) or DMSO.
Drug treatments and reverse transcription-PCR (RT-PCR)
Cells were seeded in 60 mm plates (1×10⁶ cells/plate) and cultured for 24 h, followed by drug treatment in DMEM with 5% FBS for various lengths of time. Control plates received vehicle control for the same period of time. Subsequently, total RNA was extracted using RNeasy Mini Kit (Qiagen GmbH). Genomic DNA was removed using RNase-free DNase I. cDNA was synthesized using M-MLV reverse transcriptase and random primers (Invitrogen; Thermo Fisher Scientific, Inc.). Each sample was aliquoted, and two to three independent PCRs were performed per sample. The primers for PCR were: BLID (NM_001001786.2) forward, 5′-TGTTGCCTATAGAGGGCCAG-3′ and reverse 5′-CTGAAGCACATGTCCAGGAA-3′ and GAPDH (NM_002046) forward, 5′-CCAGGAAATGAGCTTGACAAAGTG-3′ and reverse, 5′-AAGGTCATCCCTGAGCTGAACGGG-3′. The PCR thermocycling conditions were 94°C for 90 sec followed by 30 cycles of 94°C for 3 sec, 55°C for 3 sec, and 68°C for 3 sec, with a final extension at 72°C for 7 min. Samples were electrophoresed on 2% agarose gels with ethidium bromide. Images were captured using a FlouroChem Gel Document system at the Genomics and Epigenomics Shared Resource (GESR) of Georgetown Lombardi Comprehensive Cancer Center, and the data were quantified using ImageJ version 1.42q software (National Institutes of Health). Data were normalized to GAPDH, and fold changes in BLID expression relative to the vehicle control were calculated.
Reverse transcription-quantitative PCR (RT-qPCR)
A total of 2 µg RNA was reverse transcribed using random primers (Invitrogen; Thermo Fisher Scientific, Inc.). The cDNA was diluted 1:3 in nuclease-free water, and 2 µl of the diluted sample was analyzed in triplicate by qPCR using Fast-SYBR Green qPCR Master Mix (Invitrogen; Thermo Fisher Scientific, Inc.) with 0.1 µmol/l of both the forward and reverse primers. The total volume of the reaction mixture was 20 µl. qPCR was performed on an ABI Prism 7900HT (Applied Biosystems; Thermo Fisher Scientific, Inc.) in Fast-mode. The PCR thermocycling conditions were 95°C for 2 min, followed by 4° cycles of 95°C for 3 sec, annealing at 55°C for 30 sec, and 68°C for 30 sec. The negative control used was water instead of cDNA. The relative gene expression level was normalized to a calibrator (basal sample), and the final result was expressed as n-fold difference in gene expression relative to GAPDH and the calibrator, calculated using the 2−∆∆Cq method (22). The sequences of the primers were: AKR1C3 forward, 5′-GGGTTCCGCCATATAGATTCTG-3′ and reverse, 5′-ACTCTGGTCGATGAAAAGTGG-3′; IFIT3 forward, 5′-CCTACTCTCCCACCCCTTTATA-3′ and reverse, 5′-CAGGGAATTCTTGGTGACCTC-3′; IFNB1 forward, 5′-CTAACTGCAACCTTTCGAAGC-3′ and reverse, 5′-CTAACTGCAACCTTTCGAAGC-3′; XAF1 forward, 5′-GAGAGCAGAACATGGAAGGAG-3′ and reverse, 5′-GAGGGTGAAGTTGGCAGA-3′; PRKX forward, 5′-TTAAGCTCACGGACTTTGGG-3′ and reverse, 5′-CGAATATCAGGATGCCGAGG-3′; CSF1 forward, 5′-CGCTTCAGAGATAACACCCC-3′ and reverse, 5′-TCATAGAAAGTTCGGACGCAG-3′; IFIT2 forward, 5′-CCTCATCCCTTCAGCATCAAG-3′ and reverse, 5′-GTCCAATCTTTTGCCATACCAG-3′; AKAP12 forward, 5′-GCACAGTGAATCAGATAAAGCG-3′ and reverse, 5′-TGTCTTCACATTCTGGTCTTCC-3′; CHRDL1 forward, 5′-AGAAGTACAGAGTGGGTGAGAG-3′ and reverse, 5′-CACAGGAGAAAGGCAATGAAC-3′; TP73 forward, 5′-GTTTACAAGAAAGCGGAGCAC-3′ and reverse, 5′-GTCATCCACATACTGCGAGAG-3′; DFNA5 forward, 5′-AACTCCAGATCATTCCCACAC-3′ and reverse, 5′-CTGCACAATCCCAAACCTTTC-3′; BLID (set 1): forward, 5′-TGAGGATTTTGGTGAGTAGCC-3′ and reverse, 5′-ATAAGCACGGTGTTAGATGGG-3′; BLID (set 2): forward, 5′-ATGAATAGCAGGAGCTGGGA-3′ and reverse, 5′-CTGTGTTGTGCAGCCTGAAT-3′; and β-Actin forward, 5′-TACCTCATGAAGATCCTCACC-3′ and reverse, 5′-TTTCGTGGATGCCACAGGAC-3′.
Dual-luciferase reporter assay
Cells were seeded in 24-well plates (5×10⁴ cells/well) and incubated overnight. The cells were then co-transfected with the BLID reporter (pGL3 BLID) or pGL3-enhancer (pGL3 Basic) (0.1–0.5 µg/well) and Renilla luciferase internal transfection control pRL-TK vector (100 ng/well) using FuGENE HD reagent. The following day, the medium was replaced with fresh medium containing one of the drugs for 24 h. Control cells were treated with vehicle for 24 h. Additional controls included untransfected cells and plasmid DNA without cells. The cells were then washed twice in PBS. Firefly/Renilla luciferase activity in the cells was measured using the dual-luciferase reporter assay and normalized against pRL-TK according to the manufacturer's protocol (Promega Corporation).
Chromatin immunoprecipitation (ChIP) and ChIP-quantitative PCR (ChIP-qPCR)
Subconfluent cell cultures were grown in 100-mm plates, and treated with one of the drugs in DMEM supplemented with 5% FBS and 2 mmol/l glutamine. ChIP was performed using an EZ-Magna ChIP kit according to the manufacturer's protocol (cat. no. 17–409, MilliporeSigma). Briefly, cells were cross-linked using 1% formaldehyde for 10 min at 37°C, washed in ice-cold PBS and resuspended in cell lysis buffer containing 1× protease inhibitor cocktail and incubated for 15 min on ice. The cell suspension was spun at 800 × g at 4°C for 5 min, and the pellet was resuspended in nuclear lysis buffer and incubated on ice for 20 min, followed by sonication to obtain 500 bp DNA fragments. Sonication was performed using the Misonix Sonicator 3000 (Misonix) with 15 pulses of 10 sec each at output level 5. This was followed by centrifugation at 10,000 × g at 4°C for 10 min, and the supernatant was used directly for immunoprecipitation with 5 µg of anti-FOXO3a, anti-FOXO4, or anti-FOXO1 antibody overnight at 4°C. A sample of diluted chromatin before immunoprecipitation was taken as a control for input levels. Immune-complexes were incubated with 20 µl of protein G-magna beads for 1 h at 4°C. Subsequently, the beads were washed five times with 1 ml each of the following buffers: Low salt wash buffer (0.1% SDS,1% Triton X-100, 2 mM EDTA, 20 mM Tris-HCl pH 8.1, 150 mM NaCl), high salt wash buffer (0.1% SDS,1% Triton X-100, 2 mM EDTA, 20 mM Tris- HCl pH 8.1, 500 mM NaCl), LiCl wash buffer (0.25 mM LiCl, 1% IGEPAL-CA630, 1% deoxycholic acid, 1 mM EDTA, 10 mM Tris-pH 8.1) and TE buffer. The immune-complexes were eluted with 100 µl of ChIP elution buffer containing 1 µl of proteinase K, and the cross-linking reaction was reversed by incubation at 62°C for 2 h. DNA was purified using spin columns. Using the transcription factor analysis software (MatInspector, Genomatix), several binding sites for FOXO proteins were found in the BLID promoter. Two sets of primers were used to detect the DNA fragments spanning predicted FOXO binding sites (S1 and S2). The BLID primer sequences were as follows: Promoter site S1 (−2128/-2444) forward, 5′-CCAACATGGTAAAACCTTGTCTCT-3′ and reverse, 5′-GGCAAAGACCCAAAGATGTATAAG-3′ and promoter site S2 (−1741/-2129) forward, 5′-CCACCTTGTATGGTGCCTGGTATA-3′ and reverse, 5′-GGGGGATTAATGAGGGAAGGAATA-3′. The ChIP-PCR/qPCR controls included chromatin precipitated with either normal rabbit IgG (S1 and S2 primers, negative control), or mouse IgG and RNA-Pol II antibody (GAPDH primers, positive control; MilliporeSigma). Each PCR reaction was performed with 2 µl of the bound DNA fraction or 1 µl of the input. The PCR conditions were as follows: Preincubation at 95°C for 2 min, followed by 30 cycles of denaturation at 95°C for 30 sec, 30 sec of annealing at 55°C, 30 sec of extension at 68°C, and 5 min of final incubation at 72°C.
For qPCR, immunoprecipitated DNA was amplified using specific primers, and Fast-SYBR Green qPCR Master Mix (Invitrogen; Thermo Fisher Scientific, Inc.) on an ABI Prism 7900HT (Applied Biosystems) in Fast-mode as detailed earlier (23).
BLID short hairpin RNA (shRNA) lentivirus transduction
BLID shRNA lentiviral particles were generated using pLKO.1-TRC containing a BLID shRNA. A set of five BLID specific shRNA clones was obtained from MilliporeSigma (Sigma-Aldrich). The BLID shRNA constructs used were as follows: Construct 1, shRNA TRCN0000265539 (RefSeq-NM_001001786.1–656s21c1) forward sequence, 5′-CCGGGGACAGATTTCGCCCATTATTCTCGAGAATAATGGGCGAAATCTGTCCTTTTTG-3′ and reverse sequence, 5′-AATTCAAAAAGGACAGATTTCGCCCATTATTCTCGAGAATAATGGGCGAAATCTGTCC-3′; construct 2, shRNA TRCN0000254449 (NM_001001786.1–516s21c1) forward sequence, 5′-CCGGTCTGCCATGAAGCGGAATGTTCTCGAGAACATTCCGCTTCATGGCAGATTTTTG-3′ and reverse sequence, 5′-AATTCAAAAATCTGCCATGAAGCGGAATGTTCTCGAGAACATTCCGCTTCATGGCAGA-3′; construct 3, shRNA TRCN0000254448 (RefSeq- NM_001001786.1–566s21c1) forward sequence, 5′-CCGGTTTAACCAGGATACAAGTTACCTCGAGGTAACTTGTATCCTGGTTAAATTTTTG-3′ and reverse sequence, 5′-AATTCAAAAATTTAACCAGGATACAAGTTACCTCGAGGTAACTTGTATCCTGGTTAAA-3′; construct 4, shRNA TRCN0000254447 (RefSeq-NM_001001786.1–387s21c1) forward sequence,5′-CCGGGCCTCTGGCAGTTCCATTTATCTCGAGATAAATGGAACTGCCAGAGGCTTTTTG-3′ and reverse sequence, 5′-AATTCAAAAAGCCTCTGGCAGTTCCATTTATCTCGAGATAAATGGAACTGCCAGAGGC-3′; and construct 5, shRNA TRCN0000254446 (RefSeq- NM_001001786.1–449s21c1) forward sequence, 5′-CCGGTTCCAACAAAGAACCTATGTTCTCGAGAACATAGGTTCTTTGTTGGAATTTTTG-3′ and reverse sequence, 5′-AATTCAAAAATTCCAACAAAGAACCTATGTTCTCGAGAACATAGGTTCTTTGTTGGAA-3′.
pLKO.1-puro scramble shRNA (Addgene: scramble shRNA Sequences; Addgene plasmid# 1864 RRID:Addgene_1864; http://n2t.net/addgene:1864) was used as the negative control.
All five shRNA clones were packaged for viral production and infection and tested for target knockdown. The BLID shRNA lentiviral plasmids and the scramble control lentiviral plasmid (Addgene cat. no. 1864) were transfected along with the packaging plasmid psPAX2 (Addgene cat. no. 12260) and the envelop expressing plasmid pMD2.G (Addgene cat. no. 12259) into 293T cells using FuGENE HD transfection reagent (Promega Corporations). Virus-containing supernatants were collected at 48 h after transfection and used for transduction of breast cancer cells. Briefly, 200 µl of lentiviral particles (<10 multiplicity of infection) were used for transfection of 1×10⁶ cells seeded the day before into 60 mm tissue culture plates, followed by selection using 2 µg/ml puromycin for 10 days. The stably transfected cells were pooled from two 60 mm plates. The pooled stable clones were tested for BLID knockdown by western blotting. The TRCN0000254447 BLID shRNA construct (sh47) was used for further studies. In addition, BLID Mission shRNA lentiviral clone (SHCLNV, TRCN0000254447) and control shRNA transduction particles (SHC202V, Mission@TRC2 pLKO.5-puro) were obtained from MilliporeSigma (Sigma-Aldrich).
siRNA treatments
Two validated stealth siRNAs targeting FOXO3a (RefSeq NM001455.3/RefSeq NM201559.2), FOXO3a (siRNA #1) (cat. no. VHS41092) and FOXO3a (siRNA #2) (cat. no. VHS41096) were obtained from Thermo Fisher Scientific, Inc. (Invitrogen). FOXO3a target sequences provided by the supplier are as follows. FOXO3a (siRNA #1), sense: 5′-GCCTAACCAGGGAAGTTTGGTCAAT-3′ and antisense: 5′-ATTGACCAAACTTCCCTGGTTAGGC-3′; FOXO3a (siRNA #2), sense: 5′-CCATGCAGACCATCCAAGAGAACAA-3′ and antisense: 5′-TTGTTCTCTTGGATGGTCTGCATGG-3′. In addition, Stealth siRNA negative control (scramble) with the same supplier's proprietary sequence designed to minimize sequence homology to any known vertebrate transcript (cat. no. 12935300, Thermo Fisher Scientific, Inc; Invitrogen) was used. For FOXO3a knockdown, 1×10⁵ breast cancer cells were seeded into six-well plates and subconfluent cultures were transfected with 100 nM of one of the FOXO3a siRNAs or scramble siRNA (Scr) in 2 ml of culture medium. The siRNA was diluted in 500 µl of Opti-MEM without antibiotic. After 10 min, Lipofectamine 2000 was added, and the mixture was incubated at room temperature for 20 min. Subsequently, the siRNA-Lipofectamine 2000 complex was added to cells and incubation continued at 37°C for 24 h or 48 h.
For BLID siRNA knockdown, we used SMARTpool: ON-TARGETplus BLID siRNA (cat. no. L-032329-02-0005) and control siRNA #1 (cat. no. D-001810-01-05) according to the supplier's instructions (Dharmacon, Inc; Horizon). Sequences of BLID siRNAs and control siRNA provided by the supplier were as follows: ON-TARGETplus human BLID (414899) siRNA-SMARTpool (cat. no. L-032329-02-0005) consisting of siRNA J-032329-17, 5′-CCAUUUAUCCAGAGGCAAA-3′, siRNA J-032329-18, 5′-GCAGCAAGAUAUUAGGACA-3′, siRNA J-032329-19, 5′-GCUCUACACAGGAUGGAUA-3′ and siRNA J-032329-20, 5′-CAUUAUUCAGGCUGCACAA-3′; and control ON-TARGETplus non-targeting siRNA #1, 5′-UGGUUUACAUGUCGACUAA-3′.
Drug dose-response and time-course analysis of BLID knockdown cells
Cell viability assay was performed to determine the effects of BLID knockdown on the chemosensitivity of breast cancer cells as detailed previously (24). Briefly, cells were seeded in DMEM complete medium supplemented with 10% FBS at a density of 1,000 cells/100 µl/well (6 wells per condition) in a 96-well plate for approximately 16 h. The following day, the medium was replaced with 100 µl complete medium with 5% FBS containing desired drug concentration and cells were further incubated for various lengths of time. Activated XTT reagent (2,3-Bis-(2-Methoxy4-Nitro-5-Sulfophenyl)-2H-Tetrazolium-5-Carboxanilide) was added to each well (25 µl/well), and incubations continued for an additional 4 h. Subsequently, the absorbance was measured at 450 nm on a Victor III spectrophotometer plate reader (Perkin Elmer). Data were normalized to untreated cells. The experiment was repeated at least two to three times.
scLBLID transfection and drug response studies
The BLID cDNA plasmid expression vector containing an enhanced CMV promoter and the scL immunoliposomes were used to formulate the BLID cDNA nanocomplex (scLBLID). A total of 4×10³ cells/well were seeded into 96-well plates. After 24 h, the cells were transfected with the desired dose of the scLBLID nanocomplex, vector, scL (Lip treatment only), or were left untransfected. A total of 2 days after transfection, one of the drugs was added at increasing concentrations (in triplicate) for 48 h. The XTT cell viability assay was performed at 48 h after incubation of the cells with the drug and the IC50 value was calculated.
Immunoblotting
Whole-cell extracts were prepared by lysing cells in NP40 lysis buffer [1% NP40, 100 mmol/l NaCl, 20 mmol/l Tris-HCl (pH 7.4), 10 mmol/l NaF, 1 mmol/l sodium orthovanadate, 30 mmol/l sodium glycerophosphate, and complete protease inhibitor cocktail (Roche)] on ice for 15 min. The cell suspension was cleared by centrifugation at 14,000 × g for 30 min at 4°C. The supernatant was analyzed by NuPAGE 4–12% gel electrophoresis and proteins were transferred to PVDF membrane. The membrane was incubated at 4°C overnight with a primary antibody followed by the secondary horseradish peroxidase-conjugated anti-mouse or anti-rabbit antibodies as appropriate. Signals were visualized using an enhanced chemiluminescence detection system (Thermo Fisher Scientific, Inc.). Densitometry analysis was performed using ImageJ (National Institutes of Health).
RNA arrays and microRNA arrays
The Affymetrix GeneChip Human U133 Plus 2.0 arrays were used for transcriptomics analysis of the BLID knockdown models of MCF-7, MDA-MB-231 and LCC9 cell lines. Data were obtained from four RNA arrays per treatment group (BLID shRNA knockdown vs. isogenic scramble shRNA control). For miRNA array studies of MCF-7, MDA-MB-231 and LCC9 cells, Affymetrix GeneChip miRNA 3.0 arrays were used. For each treatment group (BLID shRNA knockdown vs. isogenic scramble shRNA control), three miR arrays were used. The RNA arrays and microRNA arrays data were generated, processed and analyzed at GESR as described previously (24).
Antibody microarrays
The antibody microarrays (Antibody Microarray 507; Clontech, Takara Bio, Inc.) were used for proteomics studies of the BLID knockdown MCF-7, MDA-MB-231 and MDA-MB-468 cells as detailed in earlier (25,26). Data were obtained from three antibody microarrays per treatment group (BLID shRNA knockdown vs. isogenic scramble shRNA control). The antibody microarray data were generated, processed and analyzed according to the manufacturer's instructions (Antibody Microarray 507, Clontech, Takara Bio, Inc.) as described previously (25). Briefly, samples were labeled with Cy3, and applied on the microarray together with a mixture of cell proteins labeled with Cy5 as the ‘gold-standard’. Each sample was incubated with a 507 feature antibody microarray, washed, and the bound proteins were assayed on a sensitive fluorescence reader. Data from four independent technical replicates of each sample was used to perform statistical tests to evaluate the statistical significance of the results. Both sample and ‘gold-standard’ intensities were normalized to the respective median for each array. Protein intensities were corrected for spot variations by using the Cy5-labeled ‘gold-standard’ intensity on the same spot. Since the exact same ‘gold-standard’ was used for all samples the ratio of Cy3 to Cy5 intensities gave the ratio of sample to ‘gold-standard’ for each individual spot. These corrected values were used to calculate the ratios as well as the P-values for the significance of the difference between the experimental and isogenic control groups for each protein on the array.
Ingenuity Pathway Analyses of the RNA arrays and antibody microarrays datasets were performed to identify significant functional categories, canonical pathways, and connectivity maps affected in BLID knockdown breast cancer cells.
Kaplan-Meier and receiver operating characteristic (ROC) analyses
The Kaplan-Meier plotter analysis was performed to assess the association between BLID expression and overall survival of patients with breast cancer and other types of cancers. Kaplan-Meier plotter (Kaplan-Meier plotter) is a publicly available, online survival analysis tool to test the association between the expression of 30,000 genes and survival in samples from 21 tumor types (27–31). An Auto best cut-off option was used to compute all possible cut-off values to get the best performing threshold in survival analysis. The BLID gene name was entered and the best cut-off point was selected, the comparison result between the high and low BLID expression groups was displayed with a 95% confidence interval, risk ratio and log-rank P-value.
The correlation of BLID expression and treatment response was evaluated based on the ROC curve, calculating the area under the curve (AUC) using the ROC-plotter tool (https://rocplot.com/). The ROC plotter is an online transcriptome-level tool for predicting biomarkers of treatment outcome (32,33). In addition to a P-value and an AUC value, the strongest cutoff is available for best discrimination between responder and non-responder patients. True positive rate (TPR) informs how well a model identifies true positive cases while true negative rate (TNR) shows how well it identifies true negative cases. The JetSet tool was selected to identify the optimal microarray probe set to represent BLID. The BLID gene was entered and ROC analysis was performed to determine the complete pathological response of patients with breast cancer to treatment with anthracyclines. Furthermore, the correlation between BLID expression and melanoma response to any immune checkpoint inhibitor therapy was interrogated.
Statistical analysis
The GraphPad Prism software (Dotmatics) was used to perform the tests for statistical significance. For comparison between two groups, statistically significant differences were determined using a 2-tailed, unpaired Student's t-test. For comparison between more than two groups, one-way ANOVA with Tukey's multiple-comparison test was used. P<0.05 was considered to indicate a statistically significant difference.
Results
Chemotherapeutic drugs stimulate BLID expression
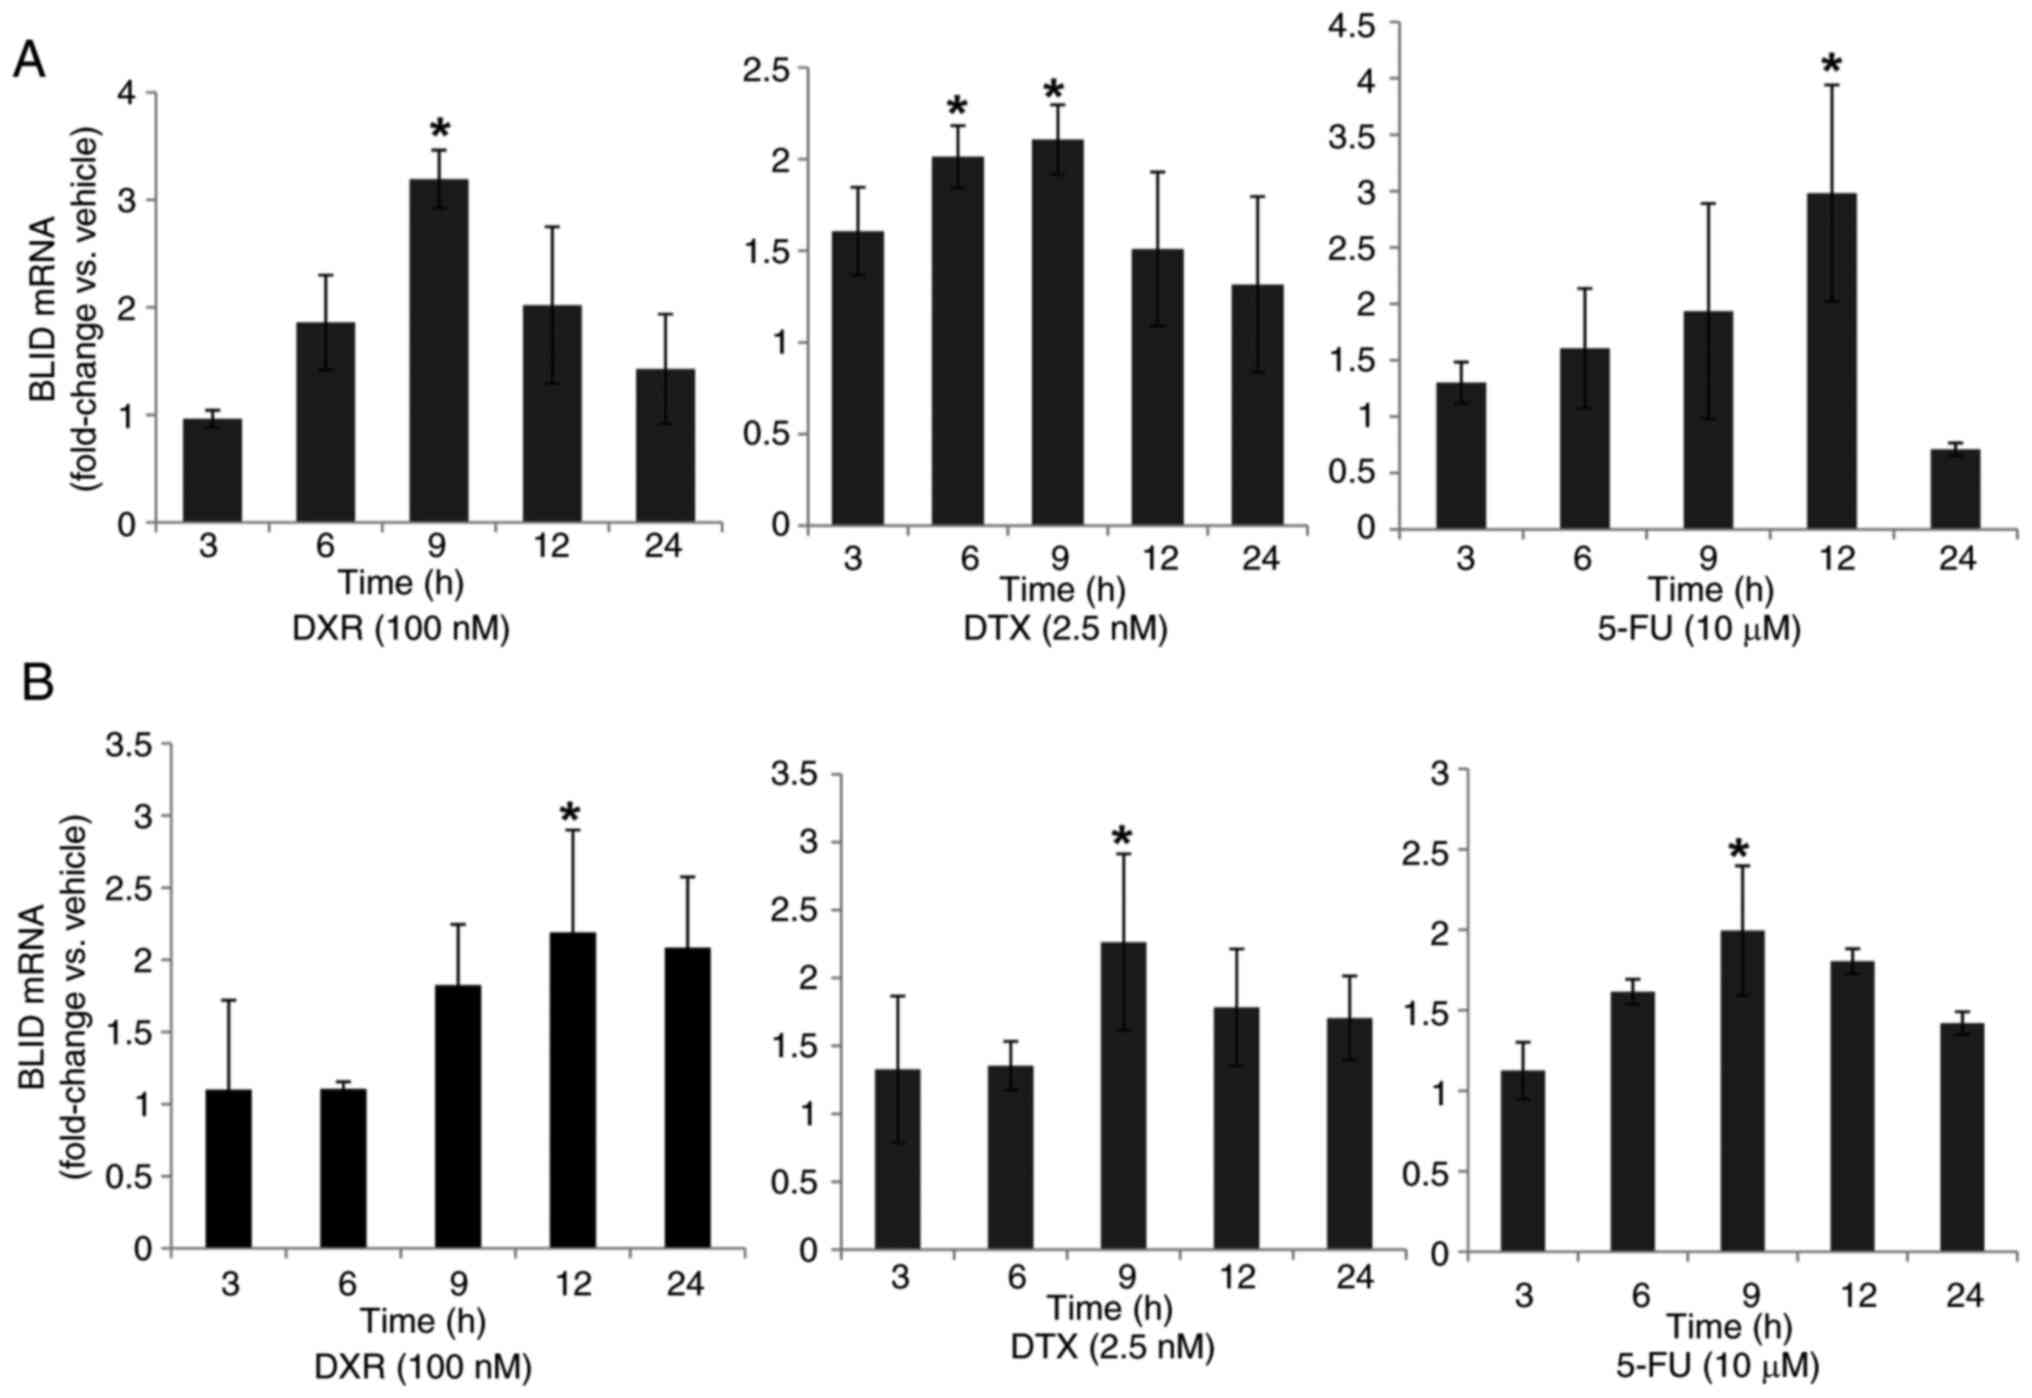
First, the effects of several drugs on endogenous BLID mRNA expression levels in breast cancer cells were assessed. The time-course and dose-response analyses revealed prolonged induction of BLID mRNA expression, albeit to varying extents, in MCF-7 and T47D breast cancer cells treated with DXR, DTX or 5-FU (Figs. 1, S1 and S2). Overall, a 2–3-fold maximal induction of BLID expression was observed with all three drugs in both cell lines. Similar observations were made in MCF-7 cells treated with PTX (Fig. S2). The BLID luciferase reporter activity was also increased 2-6-fold following DXR, PTX, DTX or Cis treatment (Fig. S3, Fig. S4, Fig. S5). Collectively, these results demonstrate that BLID expression was significantly induced in breast cancer cells in response to a wide range of chemotherapeutic drugs (P<0.05).
BLID is a target of pro-apoptotic transcription factor FOXO3a
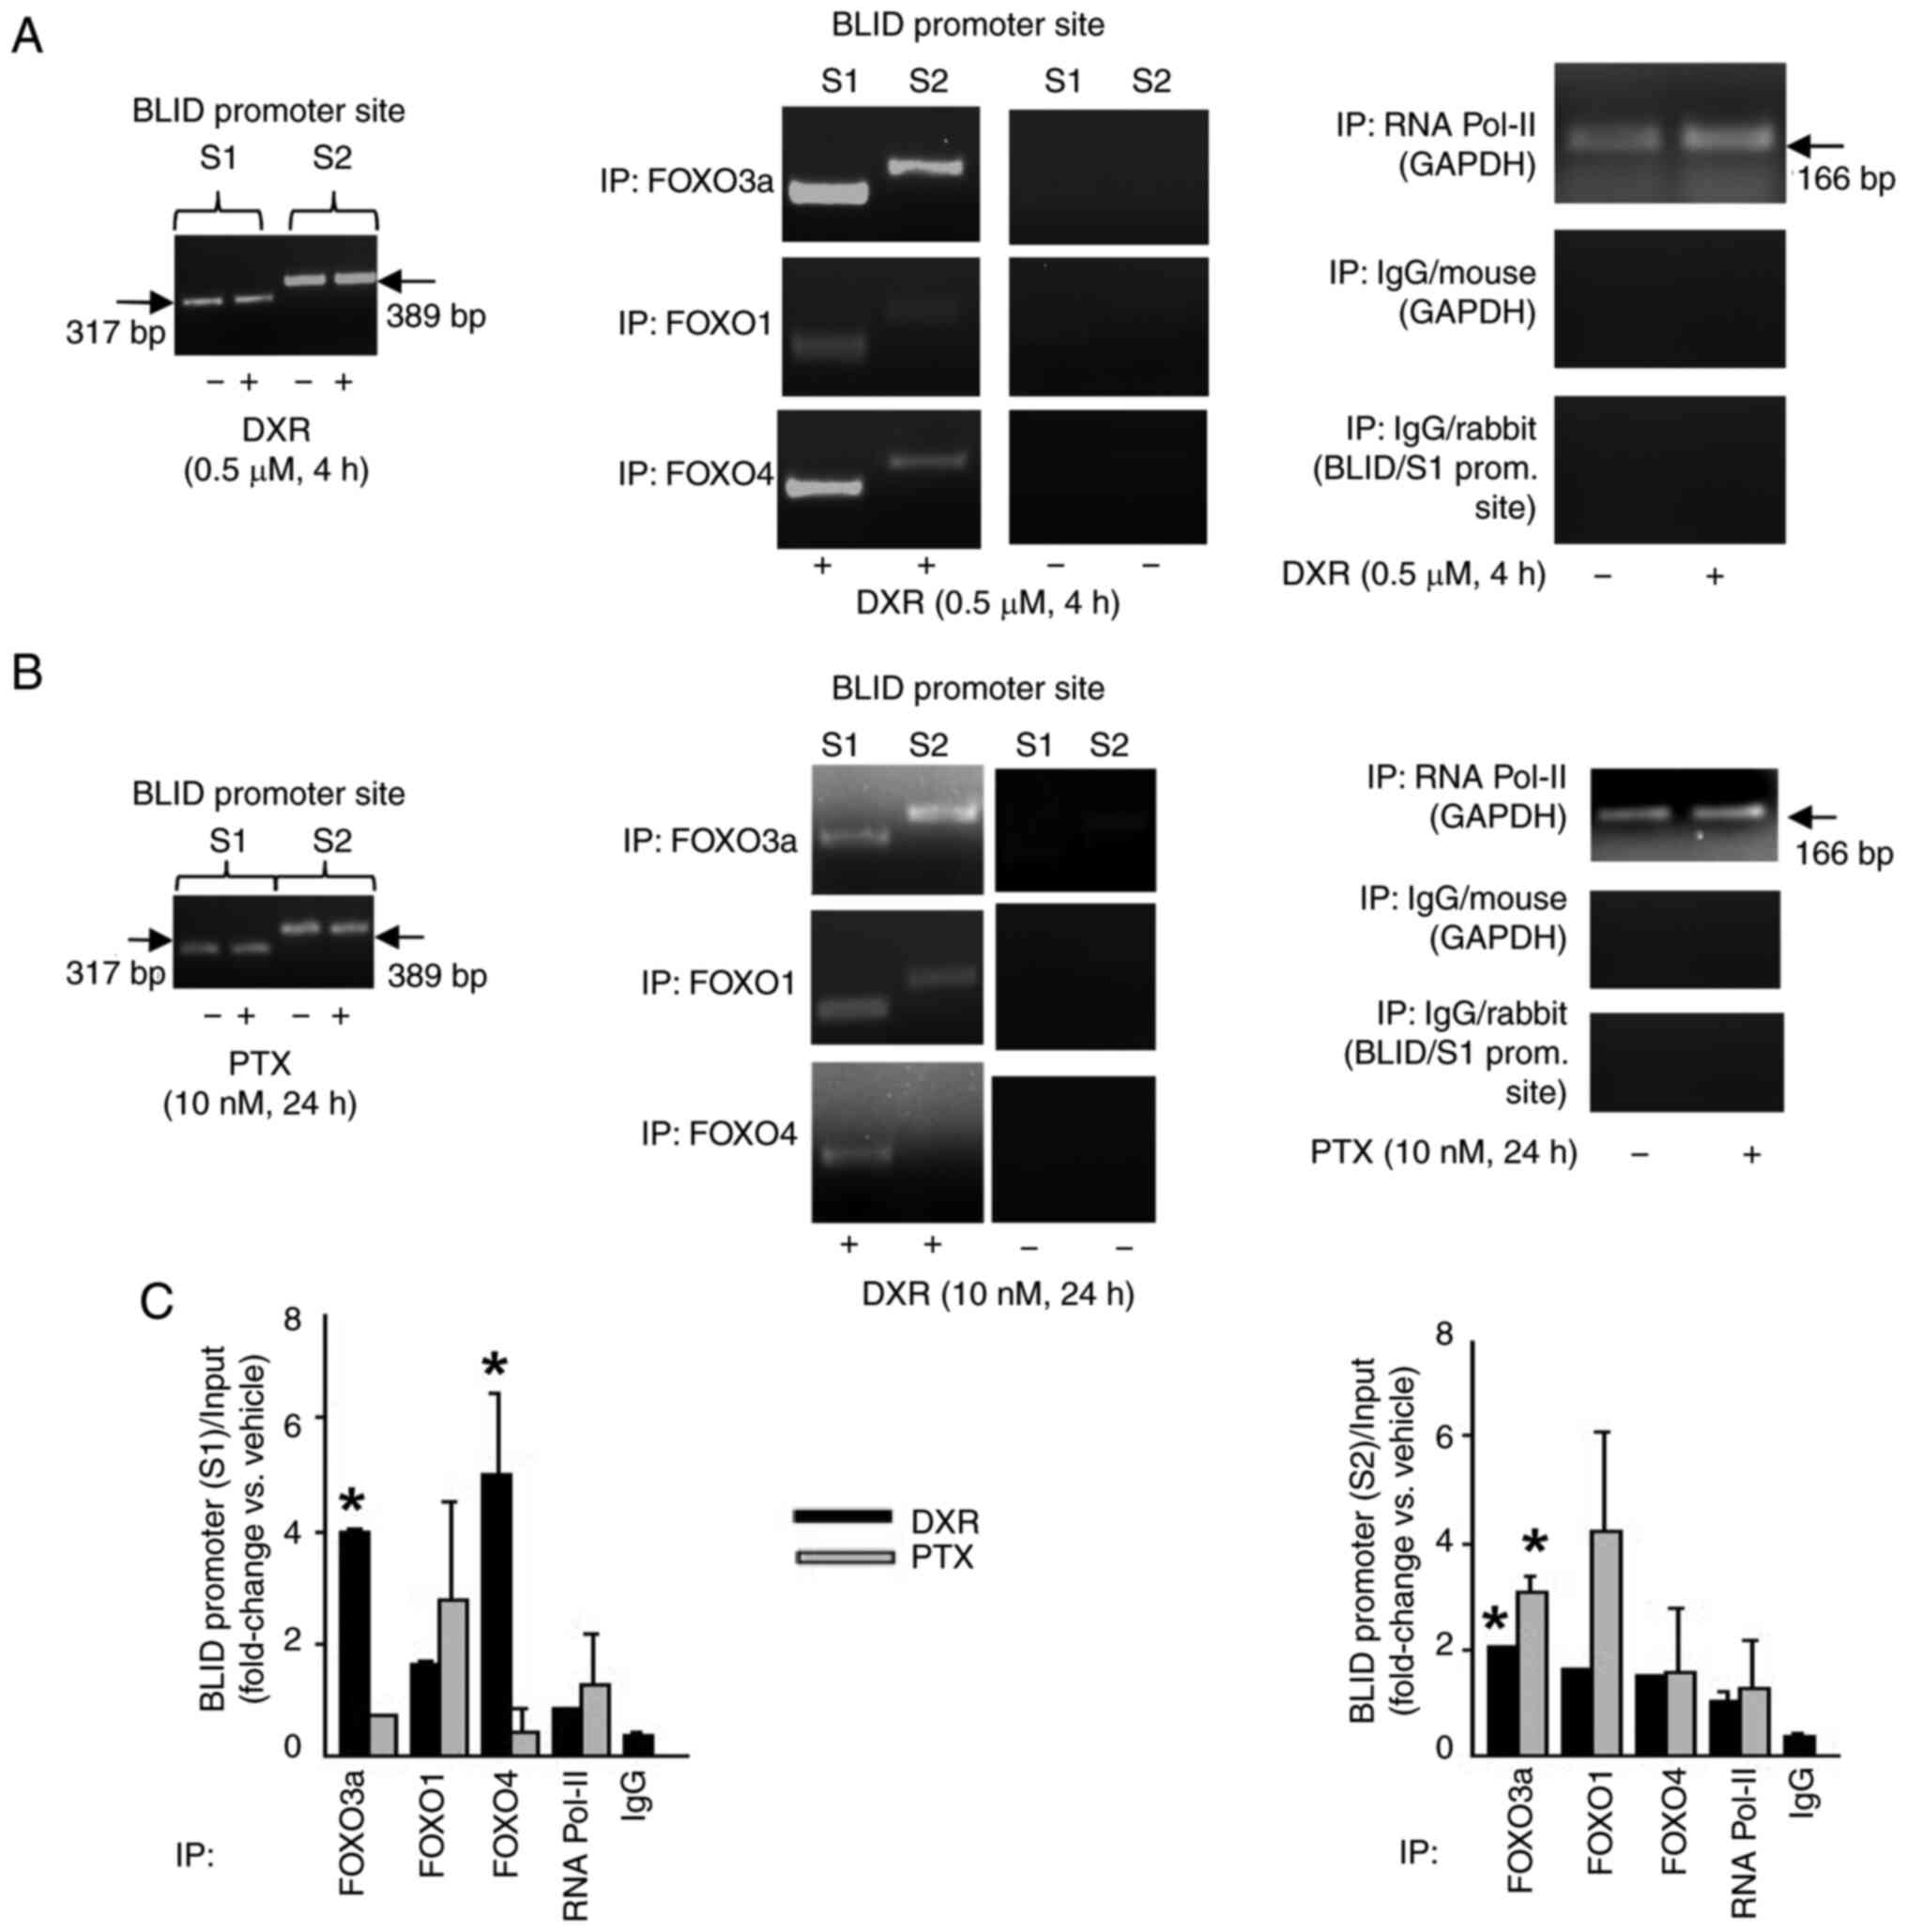
The binding sites for FOXO proteins, including FOXO3a, in the BLID promoter are shown in Fig. S3A. Next, whether BLID was a downstream effector of FOXO3a was evaluated. As shown in both the ChIP-PCR and ChIP-qPCR assays, treatment of MCF-7 cells with DXR or PTX increased the binding of FOXO proteins to the BLID promoter (Fig. 2). Furthermore, knockdown of FOXO3a was associated with reduced BLID mRNA and protein expression, and a ~ 3-fold decrease in DXR-induced BLID luciferase reporter activity (Fig. S6). These data support the notion that BLID is a drug-inducible target downstream of FOXO3a.
BLID knockdown is associated with reduced cytotoxicity following treatment with chemotherapeutic drugs
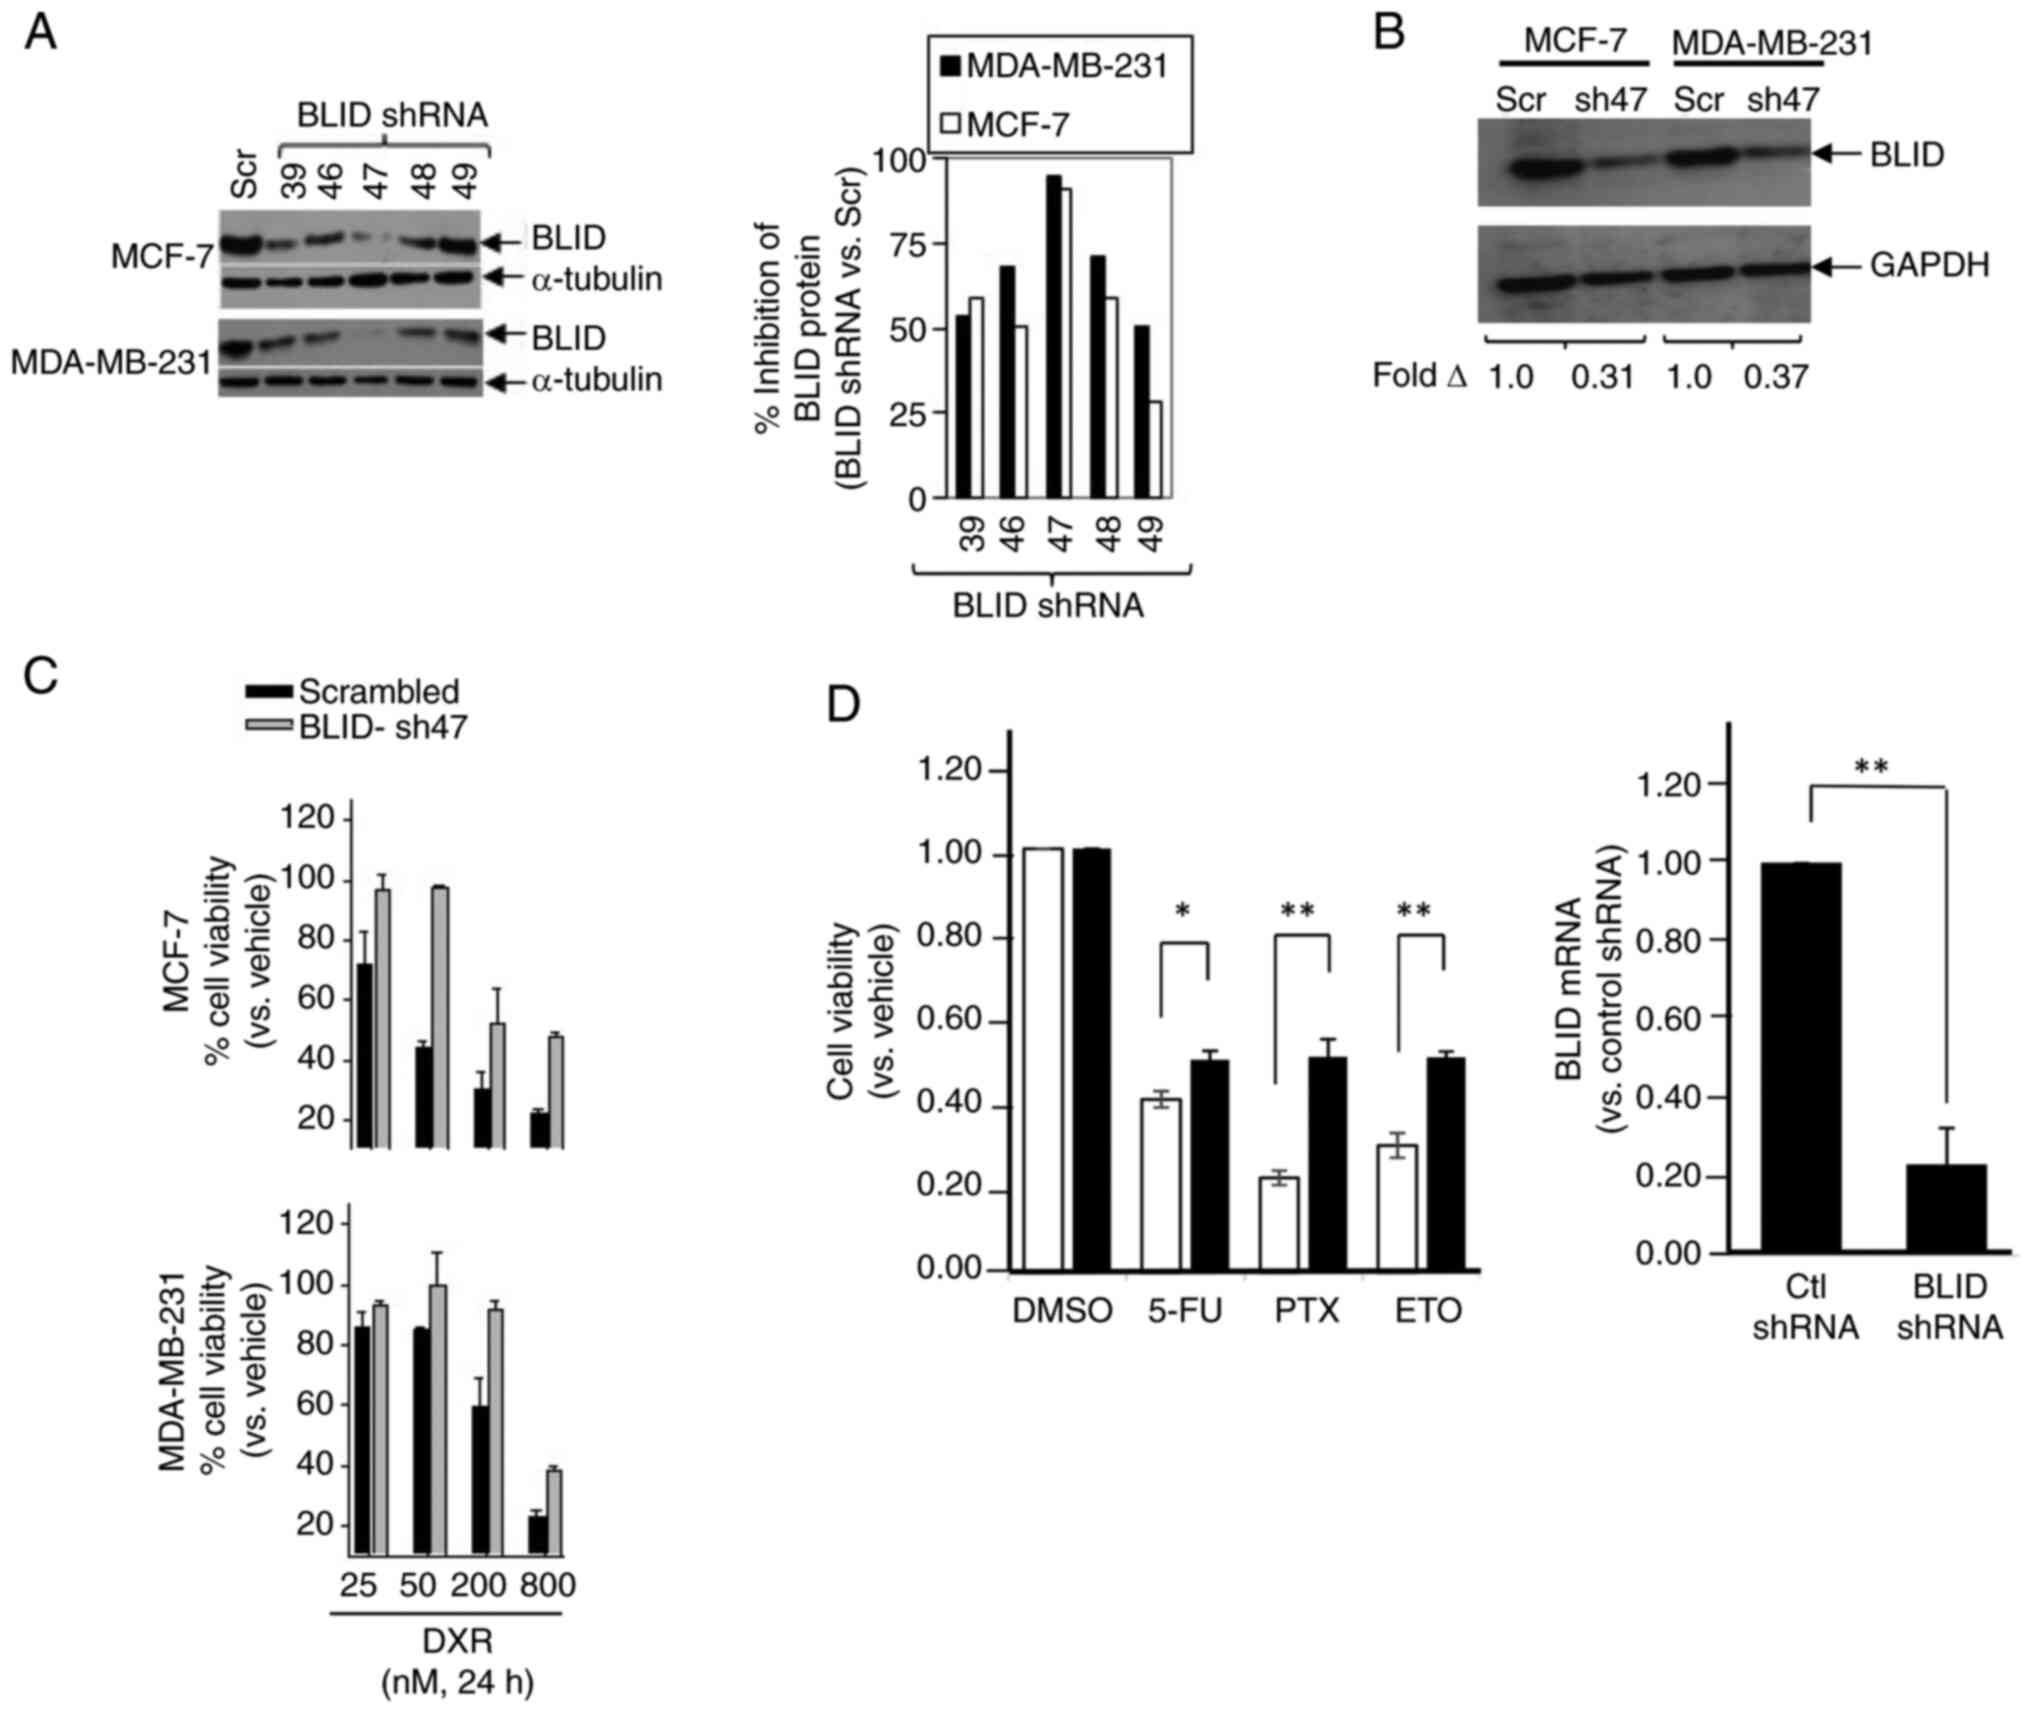
MCF-7 and MDA-MB-231 cells were transfected with one of the five different BLID shRNA lentiviral clones or scramble shRNA (Scr) (pLKO.1-TRC) and BLID knockdown was determined by western blot. As shown in Fig. 3A and B, transfection with BLID shRNA clone 47 (sh47) resulted in ~90% knockdown of BLID expression compared with scramble shRNA in both cell lines. Furthermore, BLID knockdown resulted in increased cell viability in cells treated with DXR in a dose-dependent manner in both cell lines (Fig. 3C). Similar observations were made in BLID knockdown MCF-7 cells exposed to 5-FU, PTX or ETO (Fig. 3D).
A tumor-targeting immunoliposomal nanocomplex delivery system (<300 nm) consisting of anti-transferrin receptor single chain (TfRscFv) antibody fragment and cationic liposome (the scL delivery system) has been successfully used to deliver functional P53 cDNA (scLP53) in vitro and in vivo to tumor cells and tumor tissues (34,35). The scL immunoliposomes were used to formulate the BLID cDNA nanocomplex (scLBLID). In vitro chemosensitization against DTX and DXR was observed in two hormone refractory breast cancer cell lines SKBr3 and MDA-MB-231 (Table SI). To further show the role of BLID as a potent chemosensitizer, the chemosensitization effect of scLBLID was compared with scLP53 in MDA-MB-231 cells. Remarkably, BLID-induced chemosensitization effect in MDA-MB-231 breast cancer cells exceeded that from P53 (DTX: scLBLID vs. scLP53, ~1.6-fold; DXR: scLBLID vs. scLP53, ~3.6-fold) (Table SII). These results show that BLID is a prominent determinant of breast cancer sensitivity to several mainstream chemotherapeutic drugs.
Multi-omics analysis of BLID-mediated effectors and biofunctions in breast cancer cells
To understand the effect of BLID deficiency on the molecular mechanisms underlying breast cancer survival and response to therapy, we investigated the ‘omics’ profiles of four breast cancer cell lines. Specifically, the RNA array profiles and miRNA array profiles of BLID knockdown and isogenic control were compared in MCF-7, LCC9 and MDA-MB-231 cell lines, and the antibody array profiling was performed using BLID knockdown and isogenic control MCF-7, MDA-MB-231 and MDA-MB-468 cells.
Tables SIII and SIV show the BLID-regulated mRNAs and Table SV, Table SVI, Table SVII show the BLID-regulated proteins. Additionally, potential networks in which these effectors are implicated were established. Representative networks are shown in Figs. S7 and S8. The top-ranked events (mRNAs/proteins) consistently associated with BLID knockdown in two or more cell lines were curated as shown in Table SVIII, Table SIX, Table SX, Table SXI, Table SXII. Furthermore, upregulation of seven miRs (hsa-miR-27a, hsa-miR-4649-5p, hsa-miR-3187-3p, hsa-miR-3141, hsa-miR-3196, hsa-miR-4466, hsa-miR-4497), and downregulation of one miR (has-let-7g) was observed in two or more BLID knockdown breast cancer cell lines (Table SXIII). Collectively, these data point to three functionally distinct classes of effectors that are predominantly influenced in BLID knockdown cells compared with the isogenic control cells: 1) Genes and proteins associated with cell death and survival, cellular movement and proliferation (for example BIRC3/cIAP2, PIK3CA/p110α, DFNA5/GSDME, AKAP12, CHRDL1, CSF1, TP73, THBS1 and miR-27a), 2) members of the aldo-ketoreductase family 1 associated with drug metabolism (for example AKR1C1, AKR1C2 and AKR1C3), and 3) effectors of interferon signaling and inflammatory responses (for example IFNB1/IFNβ1, IFNL2, IFIT1, IFIT2, IFIT3, IFI44L, IFI6, XAF1, RSAD2 and PRKX).
A subset of 13 effectors, shown in Tables I and II, was selected for further validation. The upregulation of cIAP2/BIRC3, PIK3CA/p110α, CSF1, AKR1C3, IFNB1/IFNβ1, IFIT2, IFIT3 and XAF1, and downregulation of DFNA5/GSDME, AKAP12, CHRDL1, TP73 and PRKX was confirmed by RT-qPCR and/or western blotting in one or more breast cancer cell lines (Figs. 4, 5 and S9). Upregulation of cIAP2/BIRC3, initially observed in the RNA array studies of MDA-MB-231 cells (Table I), was verified in these cells by western blotting. Treatment with birinapant, a SMAC-mimetic, reduced cIAP1 expression in both the control and BLID knockdown cells. In contrast, cIAP2/BIRC3 expression was seen in BLID knockdown cells and was increased (>2-fold) in the presence of birinapant (Fig. 5B). Similarly, downregulation of DFNA5/GSDME expression in BLID knockdown MDA-MB-231 cells was validated using RT-qPCR and western blotting (Figs. 4B and 5B). Increased expression of AKR1C3 and PIK3CA/p110α was verified in BLID knockdown models of MCF-7 (Figs. 4 and 5) and LCC9 cell lines (Fig. S9). In addition, the upregulation of IFIT2 and CSF1, and downregulation of AKAP12 and TP73 mRNAs was confirmed in the BLID knockdown MDA-MB-231 and LCC9 cells (Figs. 4B and S9). Interestingly, cIAP2/BIRC3 was also noted as one of the proteins in the STRING-generated BLID protein-protein interaction network (Fig. S10).
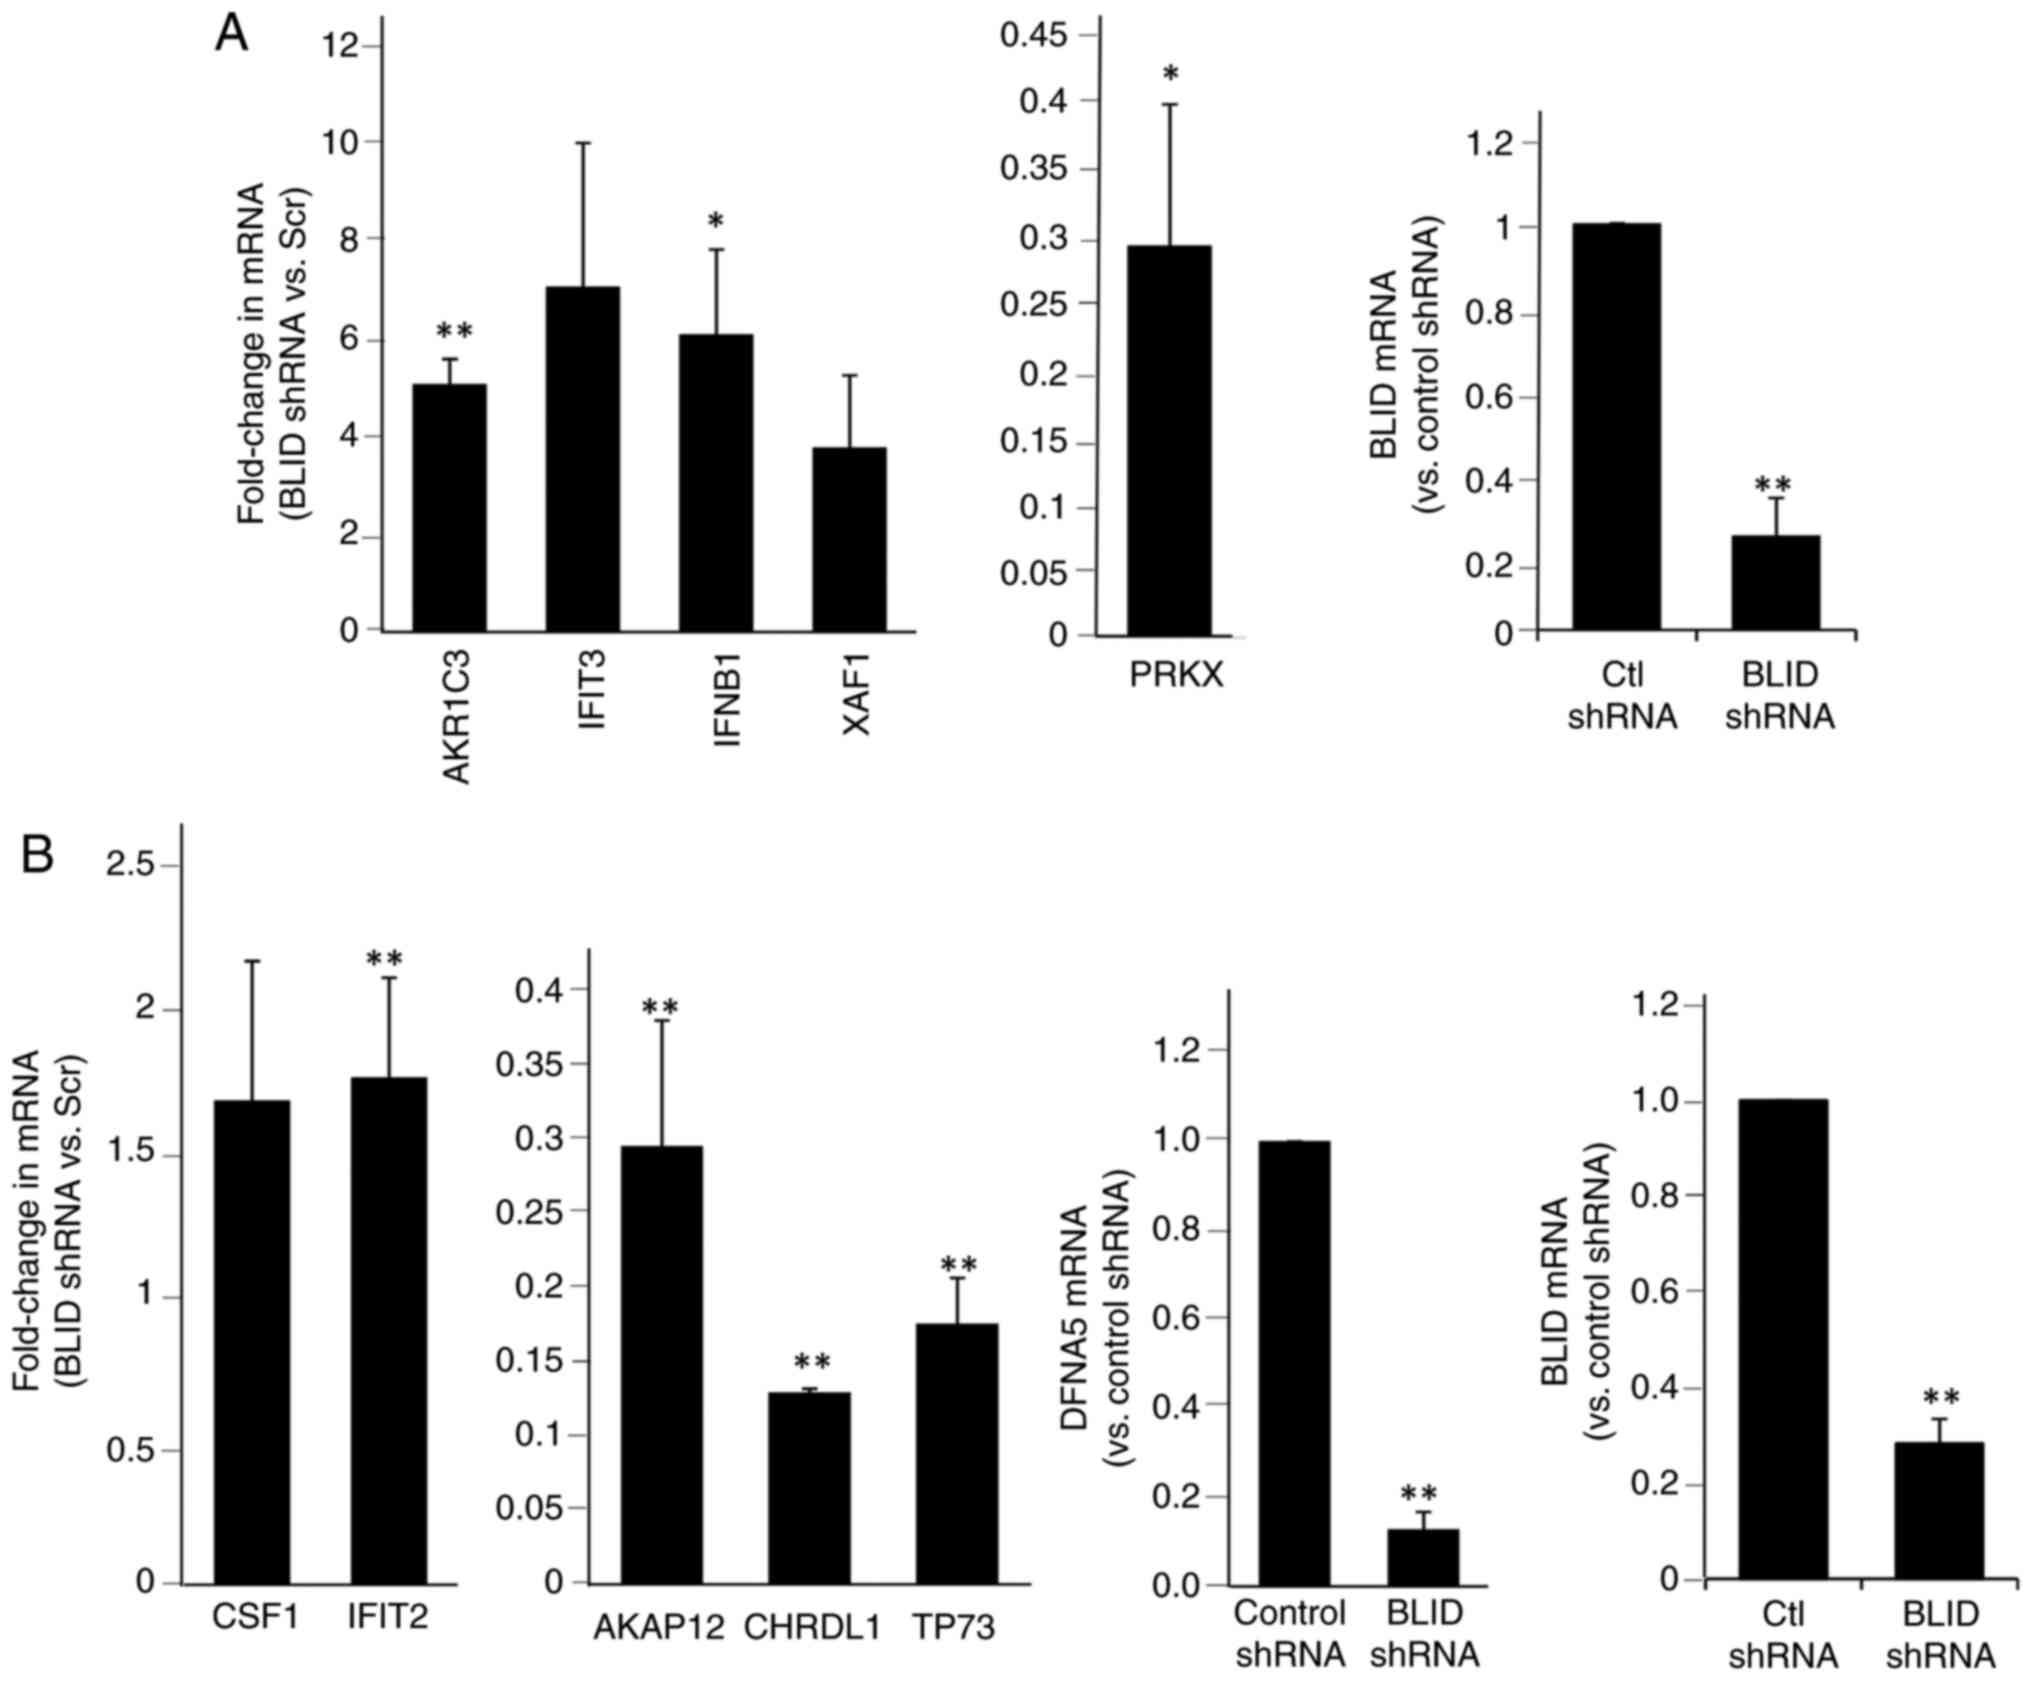
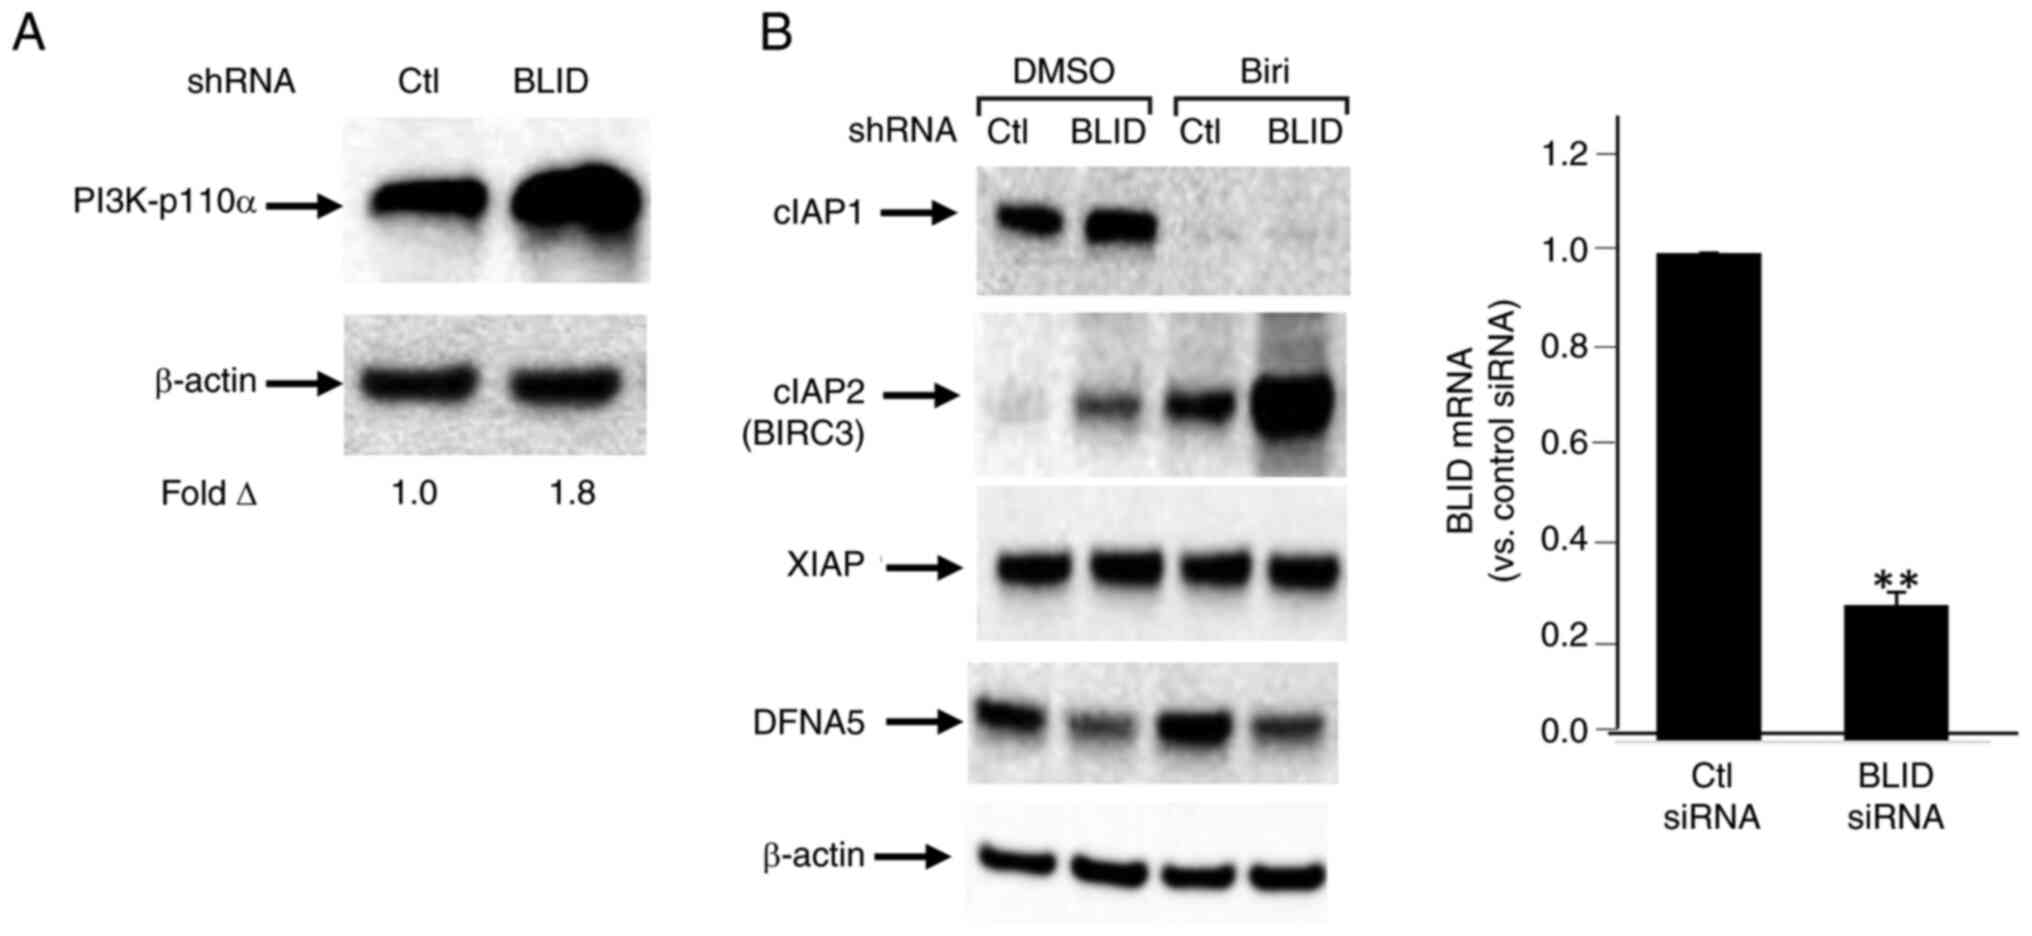
Table I.RNA array analysis-based identification of a subset of genes modulated in BLID shRNA- vs. scrambled control shRNA-transduced breast cancer cells. |
Table II.Antibody array analysis-based identification of a subset of proteins modulated in BLID shRNA- vs. scrambled control shRNA-transduced breast cancer cells. |
Cell death and survival, cellular movement, and cellular growth and proliferation emerged as the topmost biofunctions in both the BLID-mediated RNA array and antibody microarray datasets from MCF-7 and MDA-MB-231 cell lines (Tables III, SXIV and SXV). Cell death and survival was also identified as a significant BLID-regulated process in the LCC9 RNA array (Table SXIV) and MDA-MB-468 antibody microarray datasets (Table SXV). Incidentally, BLID mRNA is expressed in most normal human tissues and absent in several human cancer cell lines (Fig. S11). miR-27a expression, previously shown to be associated with poor prognosis and chemoresistance in TNBC (36), was found to be upregulated in BLID knockdown MDA-MB-231, MCF-7 and LCC9 cells (Table SXV).
Table III.Summary of top biofunctions in which BH-3 like motif containing inducer of cell death (BLID)-centric mRNAs and proteins are implicated in breast cancer cells. |
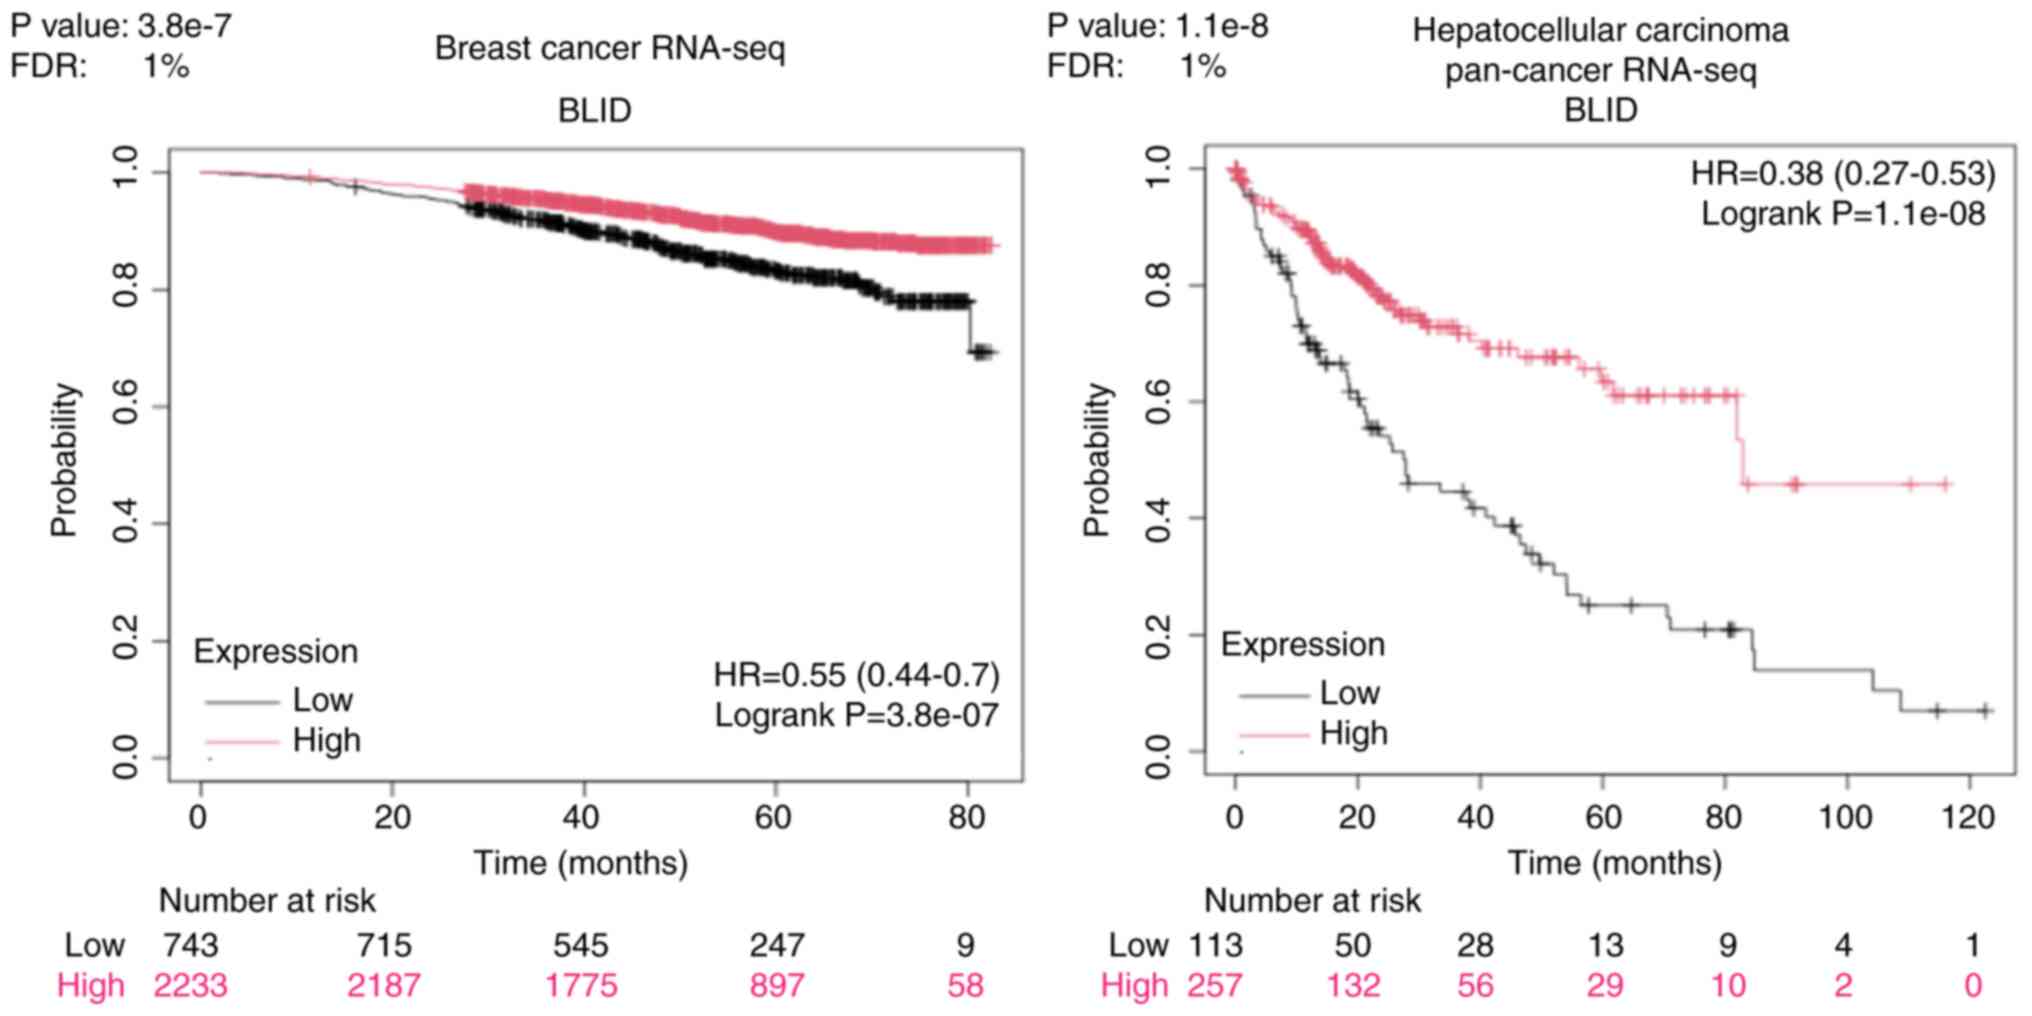
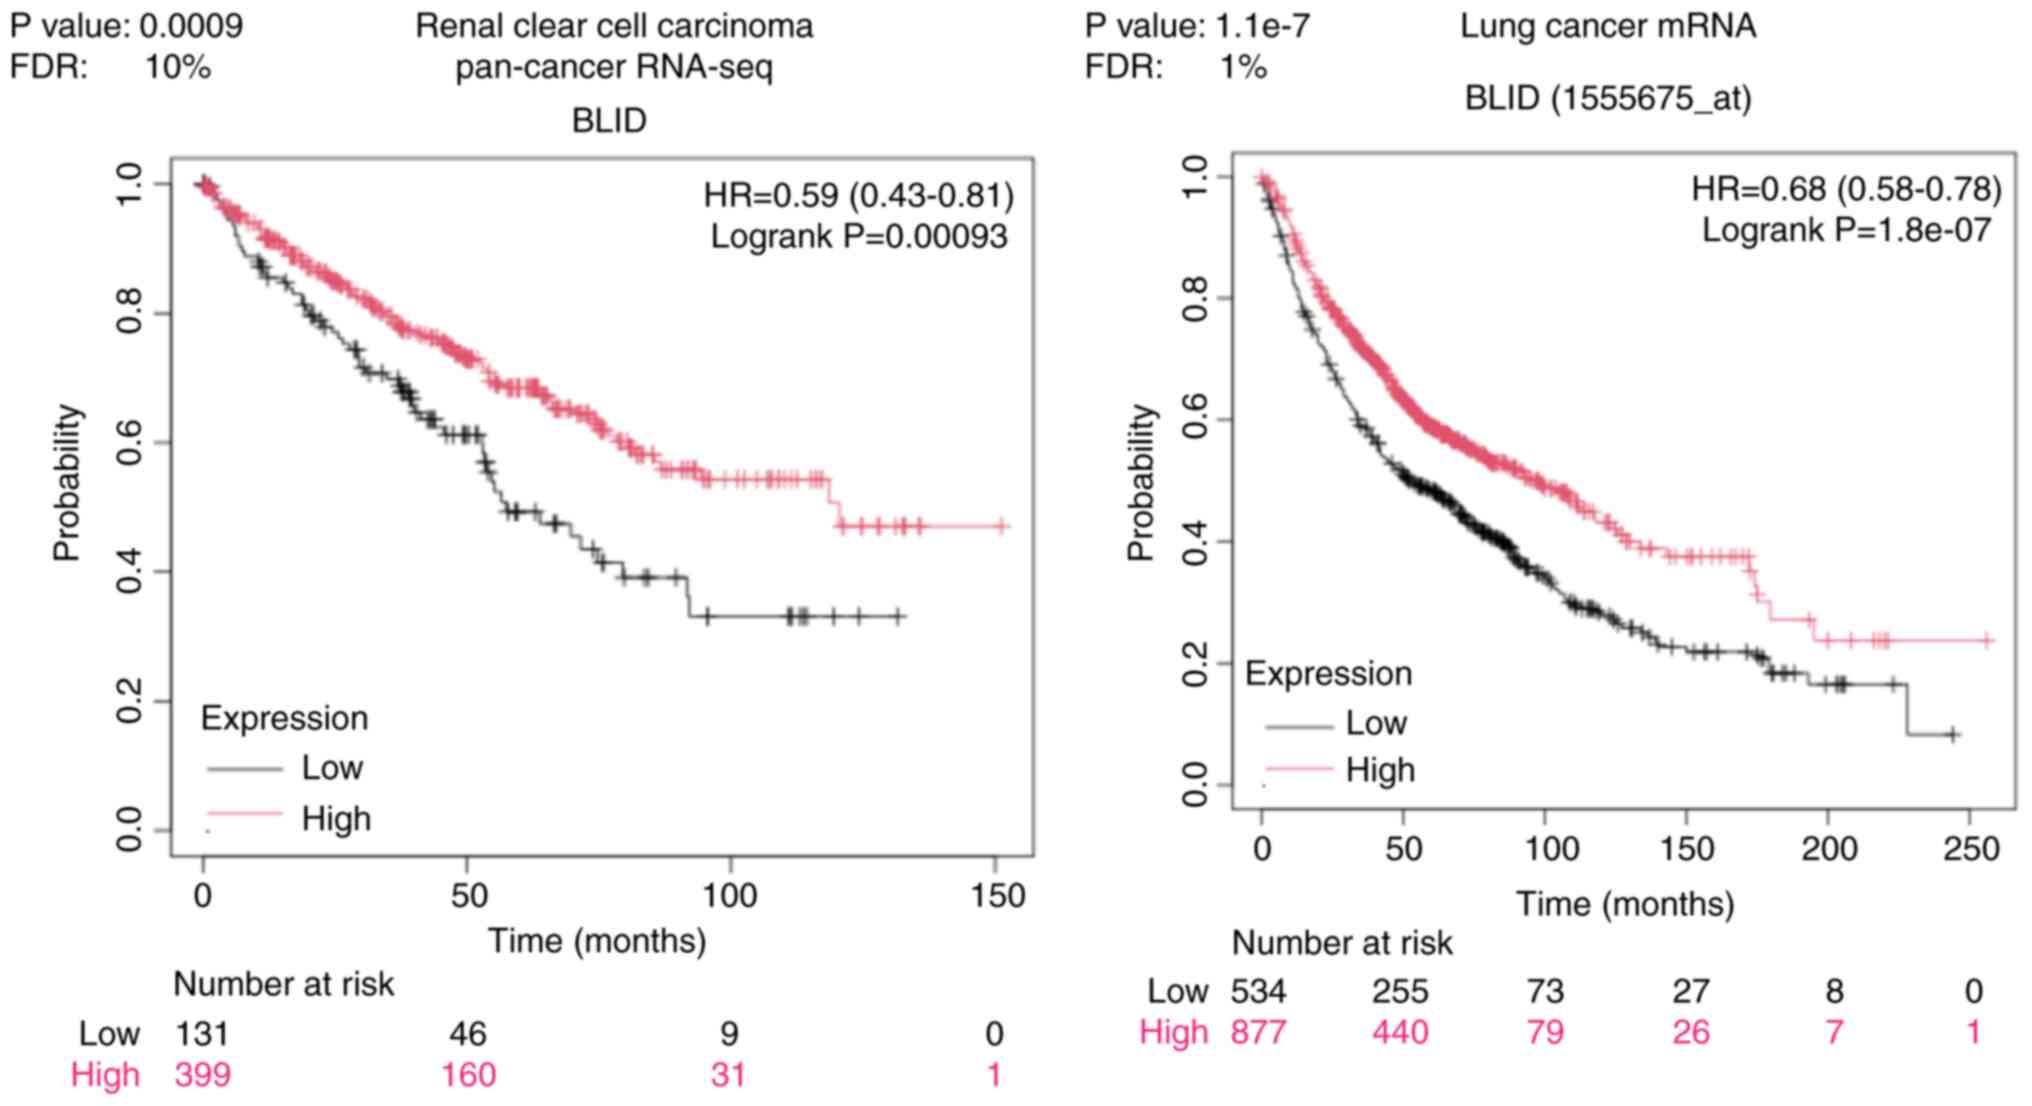
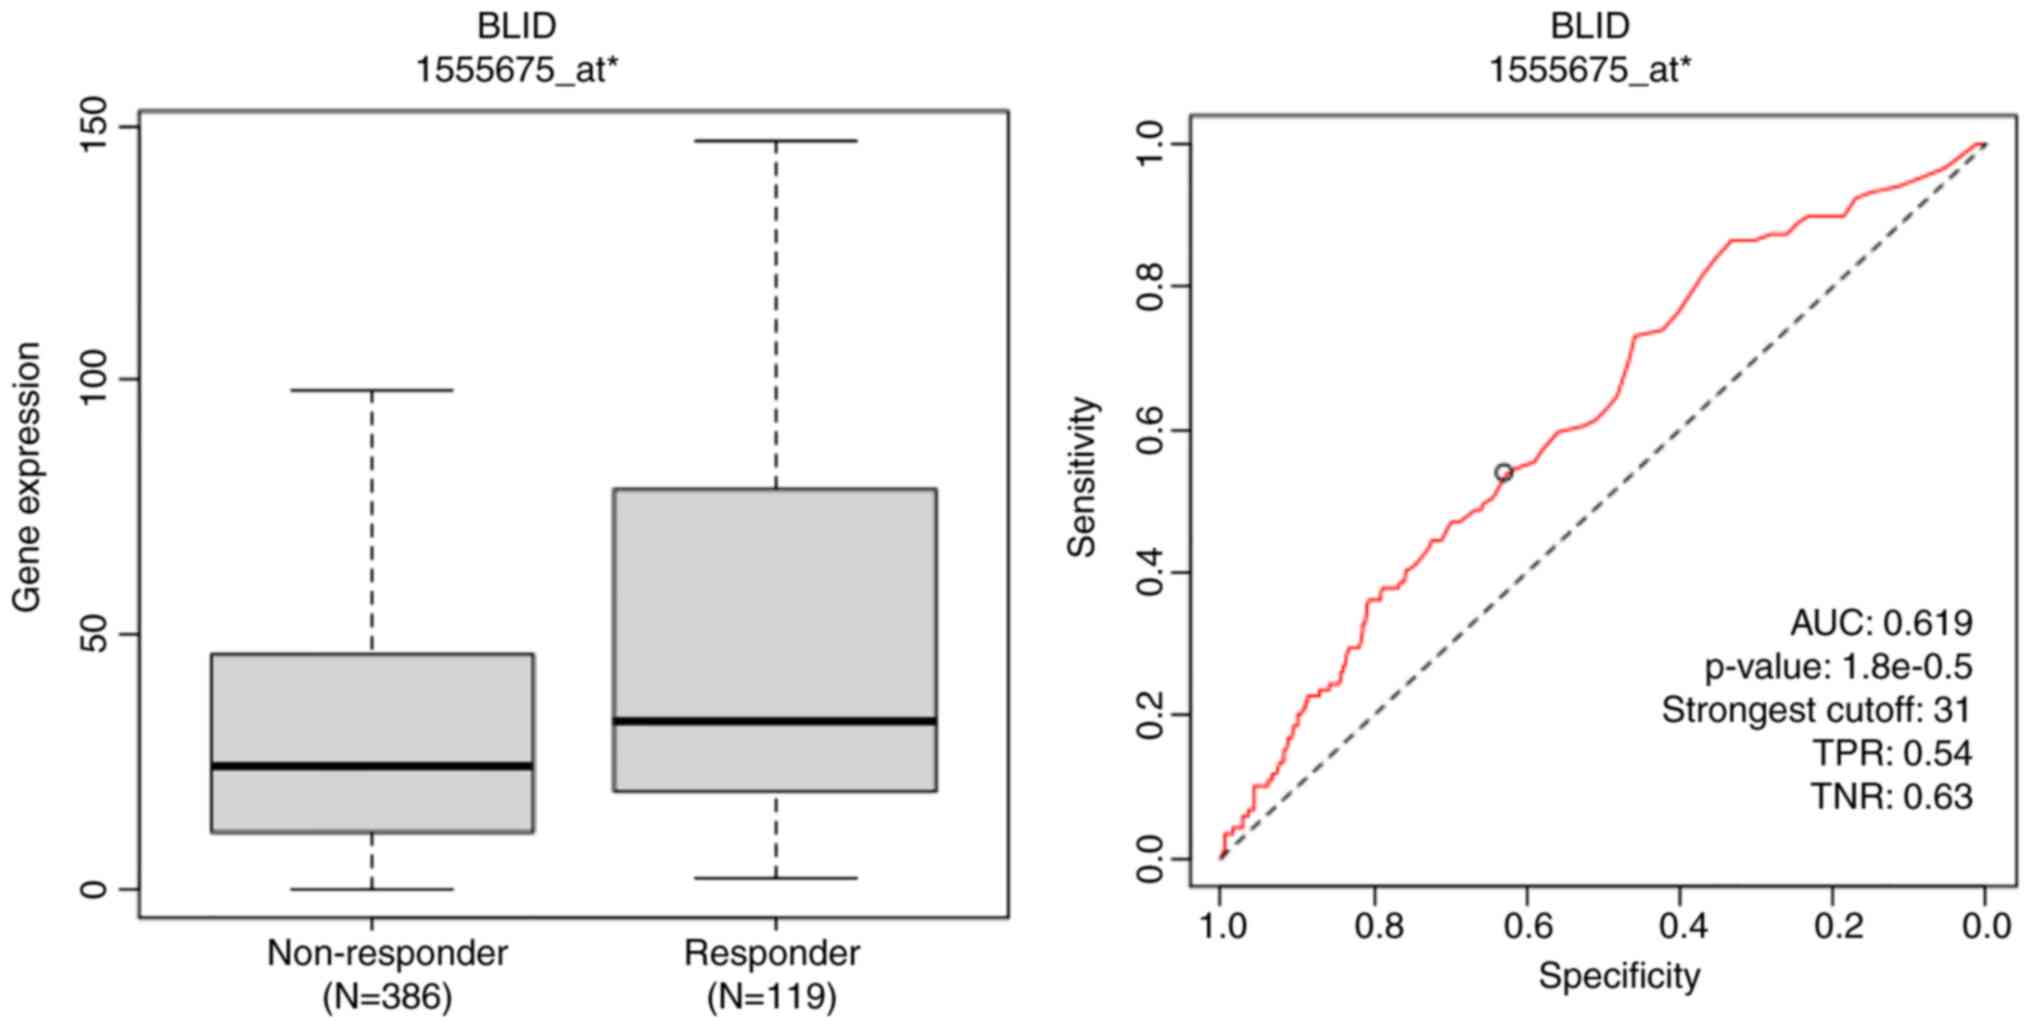
The genome and proteome-wide effects of BLID deficiency observed in multiple breast cancer models, albeit in a cellular context-dependent manner, may have far reaching implications since the publicly available RNA-seq and mRNA datasets show that downregulated expression of BLID is significantly correlated with lower survival probability not only in breast cancer but also in liver, kidney and lung cancers (all P<0.05) (Figs. 6 and 7). The computed median survival was as follows: Breast Cancer, not available; hepatocellular carcinoma, low BLID expression cohort 27.9 months and high BLID expression cohort 82.87 months; renal clear cell carcinoma, low BLID expression cohort 57.47 months and high BLID expression cohort 120.5 months; and lung cancer, low BLID expression cohort 52 months and high BLID expression cohort 95 months. Consistent with the role of BLID in breast cancer cell chemosensitivity, BLID appeared to be a predictive biomarker of breast cancer response to anthracyclines. In this context, BLID gene expression was increased ~1.5 fold in the anthracycline responder cohort (Fig. 8). BLID expression was also indicative of melanoma response to immune checkpoint inhibitor therapy (Fig. S12).
Discussion
This study is the first to report that BLID is a drug-inducible downstream effector of pro-apoptotic transcription factor FOXO3a, and BLID-deficient breast cancer cells exhibit decreased cytotoxicity of chemotherapeutic drugs. Accordingly, we propose that a dysfunctional drug/FOXO3a/BLID axis imparts drug resistance in invasive breast cancer. BLID knockdown was found to influence prominent effectors of cell death and survival, as well as drug metabolism. Of particular note, several of the transcriptomics and proteomics effects of BLID-deficiency were consistently seen and further validated in two or more models of breast cancer cells. These include upregulation of PIK3CA/p110α, AKR1C3, IFIT2 and CSF1, and downregulation of AKAP12 and TP73. Additionally, cell death and survival emerged as a highly significant BLID-mediated biofunction in all four breast cancer cell lines tested (MCF-7, MDA-MB-231, LCC9 and MDA-MB-468).
Focusing on cIAP2/BIRC3, DFNA5/GSDME, PIK3CA/p110α and AKR1C3, four of the downstream effectors of BLID revealed in this study, we posit below new fundamentals of breast cancer biology and treatment response. Genotoxic stress is known to induce the release of SMAC from mitochondria and SMAC in-turn promotes apoptosis by binding to cIAP1 and cIAP2/BIRC3, enhancing their autoubiquitination and degradation (37). Overexpression of cIAP2/BIRC3 has been associated with chemoresistance (38,39). The results of the present study showing high expression of cIAP2/BIRC3 in BLID knockdown cells in the absence or presence of a SMAC mimetic point to a link between loss of BLID, increased stabilization of cIAP2/BIRC3 protein and chemoresistance. Notably, enhanced expression of cIAP2/BIRC3 has been identified as an anti-apoptotic defense mechanism, limiting the efficacy of α-PD1 therapy in TNBC (40). It remains to be determined whether cIAP2/BIRC3 antagonist improves the effectiveness of immunotherapy in patients with BLID-negative subset of TNBC.
DFNA5/GSDME, a member of the pore-forming Gasdermin family, plays a critical role in programmed secondary necrosis or pyroptosis (41,42). Relatively high expression of DFNA5/GSDME seems to bypass apoptosis, and chemotherapeutics are known to induce pyroptosis (43,44). The decrease in DFNA5/GSDME expression observed in BLID knockdown MDA-MB-231 cells suggests that apoptosis-resistant and BLID-positive TNBC are more likely to succumb to DFNA5-mediated pyroptosis.
Hyperactivation of the PI3K pathway abrogates hormone dependence in ER+ breast cancer (45). In the present study, upregulated p110α expression was observed in BLID knockdown MCF-7, LCC9 and MDA-MB-468 cells. Thus, we hypothesize that increased expression of p110α in BLID negative breast cancer may serve as a potential therapeutic target or as a predictive biomarker for patient stratification, ultimately resulting in an improved response to a growing number of p110α-targeted drugs (46).
The data presented here suggest that BLID is an important player in the regulation of aldo-keto reductases and drug metabolism. The aldo-keto reductase isoform AKR1C3 is a well-known druggable target because of its role in detoxification of chemotherapeutic drugs (47–49). The increased expression of AKR1C3 observed in BLID knockdown cells highlights AKR1C3 as a viable target in BLID-deficient breast cancer cells.
BLID was found to be associated with interferon-responsive signals. Specifically, high expression of IFNβ1 and IFN-induced proteins with tetratricopeptide repeats (IFIT1, IFIT2, IFIT3) was observed in BLID knockdown MCF-7 and LCC9 cells. IFNβ signaling is correlated with improved survival and inversely correlated with a cancer stem cell gene signature in patients with TNBC, but not in patients with luminal breast cancers (luminal A and B) (50–52). While IFITs are primarily implicated in innate immunity, antiviral immune response, and inflammatory response (53), recent studies have revealed drug resistance activity of IFIT3 (54). Other reports suggest that high levels of immune checkpoint PD-L1 promote sustained expression of IFNβ in cancer cells (55). Furthermore, a combination of an immune checkpoint inhibitor and chemotherapy is the first-line therapy recommended for patients with triple-negative, PD-L1-positive breast cancer (56). ROC plotter analysis of BLID showed a correlation between BLID expression and melanoma response to immune checkpoint inhibitor therapy. Future investigations are required to discern whether PD-L1 is a suitable target in IFNβ positive, IFIT1/IFIT3 expressing BLID-negative breast cancer.
Finally, upregulation of miR-27a was observed in the three BLID knockdown breast cancer cells tested (MDA-MB-231, MCF-7 and LCC9). It has been previously reported that miR-27a expression is associated with poor prognosis and chemoresistance in TNBC, and miR-27a targets FOXO3a (36,57). Whether the FOXO3a/BLID axis also functions as a positive feedback regulatory mechanism in sustained activation of FOXO3a via downregulation of miR-27a remains unknown. Downregulation of let-7g miRNA was observed in MCF-7 and LCC9 models of BLID knockdown breast cancer cells, and reduced expression of let-7g is correlated with breast cancer invasion and metastasis (58).
In summary, we have demonstrated that BLID is a novel drug-inducible target of FOXO3a, and BLID knockdown breast cancer cells are resistant to chemotherapeutic drugs. The unbiased multi-omics profiling studies have revealed targetable BLID-centric effectors associated with breast cancer cell death, survival, proliferation, drug metabolism, or inflammatory processes, albeit in a cellular context-dependent manner. The lack of validation of the mechanisms regulating multiple effectors downstream of BLID including cIAP2 and miR-27a is a limitation of this study and an area for future study. Further research is also necessary to determine the functions of BLID in clinically-relevant models of various subtypes of breast cancer. In the long-term, these studies may facilitate disease prognosis and patient stratification toward the goal of improved treatment strategies for a subset of invasive breast cancer.
Supplementary Material
Supporting Data
Supporting Data
Acknowledgements
Several cell lines were obtained from the Tissue Culture Shared Resource of the Georgetown Lombardi Comprehensive Cancer Center (Washington, DC, USA).
Funding
The present study was supported by grants from the National Institutes of Health (grant nos. CA74175 and CA186944) and NeoPharm, Inc (grant no. GU-00-2-115-01). All shared resources were supported by the National Institutes of Health (grant no. P30-CA51008).
Availability of data and materials
The RNA and microRNA array data generated in the present study may be found in the Gene Expression Omnibus database under accession numbers GSE295735 and GSE295734 or at the following URLs: https://www.ncbi.nlm.nih.gov/geo/query/acc.cgi?acc=GSE295735 and https://www.ncbi.nlm.nih.gov/geo/query/acc.cgi?acc=GSE295734. The other data generated in the present study may be requested from the corresponding author.
Authors' contributions
SY, RH, AR, RV, JL, OE, XZ, EC, MS, RC and UK contributed to the conception and design of the study, performance of the experiments, data collection and analysis. SY, RH, EC, MS, RC and UK contributed to the writing and review of the manuscript. RH, RV, JL, XZ and HR contributed to the mRNA and microRNA profiling and data analysis. OE and MS performed the antibody array profiling and data analysis. SY, RH, AR, XZ, EC, MS and UK confirm the authenticity of the raw data. All authors have read and approved the final version of the manuscript.
Ethics approval and consent to participate
Not applicable.
Patient consent for publication
Not applicable.
Competing interests
The authors declare that they have no competing interests. BLID is also known as BRCC2 or BRCC-2. UK is a co-inventor of the Georgetown University patented technology ‘Gene BRCC-2 and Diagnostic and Therapeutic Uses Thereof’ (US patent 7,253,272).
References
|
Hanahan D: Hallmarks of cancer: New dimensions. Cancer Discov. 12:31–46. 2022. View Article : Google Scholar : PubMed/NCBI | |
|
Swain SM, Shastry M and Hamilton E: Targeting HER2-positive breast cancer: Advances and future directions. Nat Rev Drug Discov. 22:101–126. 2023. View Article : Google Scholar : PubMed/NCBI | |
|
Will M, Liang J, Metcalfe C and Chandarlapaty S: Therapeutic resistance to anti-oestrogen therapy in breast cancer. Nat Rev Cancer. 23:673–685. 2023. View Article : Google Scholar : PubMed/NCBI | |
|
Harbeck N, Penault-Llorca F, Cortes J, Gnant M, Houssami N, Poortmans P, Ruddy K, Tsang J and Cardoso F: Breast cancer. Nat Rev Dis Primers. 5:662019. View Article : Google Scholar : PubMed/NCBI | |
|
Hong R and Xu B: Breast cancer: An up-to-date review and future perspectives. Cancer Commun (Lond). 42:913–936. 2022. View Article : Google Scholar : PubMed/NCBI | |
|
Jin X, Zhou YF, Ma D, Zhao S, Lin CJ, Xiao Y, Fu T, Liu CL, Chen YY, Xiao WX, et al: Molecular classification of hormone receptor-positive HER2-negative breast cancer. Nat Genet. 55:1696–1708. 2023. View Article : Google Scholar : PubMed/NCBI | |
|
Park YH, Im SA, Park K, Wen J, Lee KH, Choi YL, Lee WC, Min A, Bonato V, Park S, et al: Longitudinal multi-omics study of palbociclib resistance in HR-positive/HER2-negative metastatic breast cancer. Genome Med. 15:552023. View Article : Google Scholar : PubMed/NCBI | |
|
Pacini C, Duncan E, Gonçalves E, Gilbert J, Bhosle S, Horswell S, Karakoc E, Lightfoot H, Curry E, Muyas F, et al: A comprehensive clinically informed map of dependencies in cancer cells and framework for target prioritization. Cancer Cell. 42:301–316.e9. 2024. View Article : Google Scholar : PubMed/NCBI | |
|
Calissi G, Lam EW and Link W: Therapeutic strategies targeting FOXO transcription factors. Nat Rev Drug Discov. 20:21–38. 2021. View Article : Google Scholar : PubMed/NCBI | |
|
Sunters A, Madureira PA, Pomeranz KM, Aubert M, Brosens JJ, Cook SJ, Burgering B, Coombes RC and Lam EW: Paclitaxel-induced nuclear translocation of FOXO3a in breast cancer cells is mediated by c-Jun NH2-terminal kinase and Akt. Cancer Res. 66:212–220. 2006. View Article : Google Scholar : PubMed/NCBI | |
|
Ho KK, McGuire VA, Koo CY, Muir KW, de Olano N, Maifoshie E, Kelly DJ, McGovern UB, Monteiro LJ, Gomes AR, et al: Phosphorylation of FOXO3a on Ser-7 by p38 promotes its nuclear localization in response to doxorubicin. J Biol Chem. 287:1545–1555. 2012. View Article : Google Scholar : PubMed/NCBI | |
|
Pellegrino M, Rizza P, Donà A, Nigro A, Ricci E, Fiorillo M, Perrotta I, Lanzino M, Giordano C, Bonofiglio D, et al: FoxO3a as a positive prognostic marker and a therapeutic target in tamoxifen-resistant breast cancer. Cancers (Basel). 11:18582019. View Article : Google Scholar : PubMed/NCBI | |
|
Gómez Tejeda Zañudo J, Mao P, Alcon C, Kowalski K, Johnson GN, Xu G, Baselga J, Scaltriti M, Letai A, Montero J, et al: Cell line-specific network models of ER+ breast cancer identify potential PI3Kα inhibitor resistance mechanisms and drug combinations. Cancer Res. 81:4603–4617. 2021. View Article : Google Scholar : PubMed/NCBI | |
|
Luo L, Zhang Z, Qiu N, Ling L, Jia X, Song Y, Li H, Li J, Lyu H, Liu H, et al: Disruption of FOXO3a-miRNA feedback inhibition of IGF2/IGF-1R/IRS1 signaling confers Herceptin resistance in HER2-positive breast cancer. Nat Commun. 12:26992021. View Article : Google Scholar : PubMed/NCBI | |
|
McLysaght A and Hurst LD: Open questions in the study of de novo genes: What, how and why. Nat Rev Genet. 17:567–578. 2016. View Article : Google Scholar : PubMed/NCBI | |
|
Broustas CG, Gokhale PC, Rahman A, Dritschilo A, Ahmad I and Kasid U: BRCC2, a novel BH3-like domain-containing protein, induces apoptosis in a caspase-dependent manner. J Biol Chem. 279:26780–26788. 2004. View Article : Google Scholar : PubMed/NCBI | |
|
Broustas CG, Ross JS, Yang Q, Sheehan CE, Riggins R, Noone AM, Haddad BR, Seillier-Moiseiwitsch F, Kallakury BV, Haffty BG, et al: The proapoptotic molecule BLID interacts with Bcl-XL and its downregulation in breast cancer correlates with poor disease-free and overall survival. Clin Cancer Res. 16:2939–2948. 2010. View Article : Google Scholar : PubMed/NCBI | |
|
Cavalli LR, Santos SC, Broustas CG, Rone JD, Kasid UN and Haddad BR: Assignment of the BLID gene to 11q24.1 by fluorescence in situ hybridization. Cancer Genet Cytogenet. 186:120–121. 2008. View Article : Google Scholar : PubMed/NCBI | |
|
Cavalli LR, Noone AM, Makambi KH, Rone JD, Kasid UN and Haddad BR: Frequent loss of the BLID gene in early-onset breast cancer. Cytogenet Genome Res. 135:19–24. 2011. View Article : Google Scholar : PubMed/NCBI | |
|
Li X, Su P, Liu X, Kong X, Zhang X, Zhang H and Yang Q: Aberrant BLID expression is associated with breast cancer progression. Tumour Biol. 35:5449–5452. 2014. View Article : Google Scholar : PubMed/NCBI | |
|
Li X, Kong X, Wang Y and Yang Q: BRCC2 inhibits breast cancer cell growth and metastasis in vitro and in vivo via downregulating AKT pathway. Cell Death Dis. 4:e7572013. View Article : Google Scholar : PubMed/NCBI | |
|
Livak KJ and Schmittgen TD: Analysis of relative gene expression data using real-time quantitative PCR and the 2(−Delta Delta C(T)) method. Methods. 25:402–408. 2001. View Article : Google Scholar : PubMed/NCBI | |
|
Das PM, Ramachandran K, vanWert J and Singal R: Chromatin immunoprecipitation assay. Biotechniques. 37:961–969. 2004. View Article : Google Scholar : PubMed/NCBI | |
|
Day TF, Kallakury BVS, Ross JS, Voronel O, Vaidya S, Sheehan CE and Kasid UN: Dual targeting of EGFR and IGF1R in the TNFAIP8 knockdown non-small cell lung cancer cells. Mol Cancer Res. 17:1207–1219. 2019. View Article : Google Scholar : PubMed/NCBI | |
|
Zhang C, Kallakury BV, Ross JS, Mewani RR, Sheehan CE, Sakabe I, Luta G, Kumar D, Yadavalli S, Starr J, et al: The significance of TNFAIP8 in prostate cancer response to radiation and docetaxel and disease recurrence. Int J Cancer. 133:31–42. 2013. View Article : Google Scholar : PubMed/NCBI | |
|
Day TF, Mewani RR, Starr J, Li X, Chakravarty D, Ressom H, Zou X, Eidelman O, Pollard HB, Srivastava M and Kasid UN: Transcriptome and proteome analyses of TNFAIP8 knockdown cancer cells reveal new insights into molecular determinants of cell survival and tumor progression. Methods Mol Biol. 1513:83–100. 2017. View Article : Google Scholar : PubMed/NCBI | |
|
Györffy B, Lanczky A, Eklund AC, Denkert C, Budczies J, Li Q and Szallasi Z: An online survival analysis tool to rapidly assess the effect of 22,277 genes on breast cancer prognosis using microarray data of 1809 patients. Breast Cancer Res Treat. 123:725–731. 2010. View Article : Google Scholar : PubMed/NCBI | |
|
Menyhárt O, Nagy Á and Győrffy B: Determining consistent prognostic biomarkers of overall survival and vascular invasion in hepatocellular carcinoma. R Soc Open Sci. 5:1810062018. View Article : Google Scholar : PubMed/NCBI | |
|
Győrffy B: Survival analysis across the entire transcriptome identifies biomarkers with the highest prognostic power in breast cancer. Comput Struct Biotechnol J. 19:4101–4109. 2021. View Article : Google Scholar : PubMed/NCBI | |
|
Győrffy B: Transcriptome-level discovery of survival-associated biomarkers and therapy targets in non-small-cell lung cancer. Br J Pharmacol. 181:362–374. 2024. View Article : Google Scholar : PubMed/NCBI | |
|
Győrffy B: Integrated analysis of public datasets for the discovery and validation of survival-associated genes in solid tumors. Innovation (Camb). 5:1006252024.PubMed/NCBI | |
|
Fekete J and Győrffy B: ROCplot.org: Validating predictive biomarkers of chemotherapy/hormonal therapy/anti-HER2 therapy using transcriptomic data of 3,104 breast cancer patients. Int J Cancer. 145:3140–3151. 2019. View Article : Google Scholar : PubMed/NCBI | |
|
Kovács SA, Fekete JT and Győrffy B: Predictive biomarkers of immunotherapy response with pharmacological applications in solid tumors. Acta Pharmacol Sin. 44:1879–1889. 2023. View Article : Google Scholar : PubMed/NCBI | |
|
Kim SS, Rait A, Kim E, Pirollo KF, Nishida M, Farkas N, Dagata JA and Chang EH: A nanoparticle carrying the p53 gene targets tumors including cancer stem cells, sensitizes glioblastoma to chemotherapy and improves survival. ACS Nano. 8:5494–5514. 2014. View Article : Google Scholar : PubMed/NCBI | |
|
Pirollo KF, Nemunaitis J, Leung PK, Nunan R, Adams J and Chang EH: Safety and efficacy in advanced solid tumors of a targeted nanocomplex carrying the p53 gene used in combination with docetaxel: A phase 1b study. Mol Ther. 24:1697–1706. 2016. View Article : Google Scholar : PubMed/NCBI | |
|
Liu Y, Gong W, Panoutsopoulou K, Singer-Cornelius T, Augustin K, Bronger H, Kiechle M, Dorn J, Scorilas A, Avgeris M, et al: Association of high miR-27a, miR-206, and miR-214 expression with poor patient prognosis and increased chemoresistance in triple-negative breast cancer. Am J Cancer Res. 13:2471–2487. 2023.PubMed/NCBI | |
|
Petersen SL, Peyton M, Minna JD and Wang X: Overcoming cancer cell resistance to Smac mimetic induced apoptosis by modulating cIAP-2 expression. Proc Natl Acad Sci USA. 107:11936–11941. 2010. View Article : Google Scholar : PubMed/NCBI | |
|
Wu HH, Wu JJ, Cheng YW, Chen CY, Lee MC, Goan YG and Lee H: cIAP2 upregulated by E6 oncoprotein via epidermal growth factor receptor/phosphatidylinositol 3-kinase/AKT pathway confers resistance to cisplatin in human papillomavirus 16/18-infected lung cancer. Clin Cancer Res. 16:5200–5210. 2010. View Article : Google Scholar : PubMed/NCBI | |
|
Fulda S and Vucic D: Targeting IAP proteins for therapeutic intervention in cancer. Nat Rev Drug Discov. 11:109–124. 2012. View Article : Google Scholar : PubMed/NCBI | |
|
Sehgal K, Portell A, Ivanova EV, Lizotte PH, Mahadevan NR, Greene JR, Vajdi A, Gurjao C, Teceno T, Taus LJ, et al: Dynamic single-cell RNA sequencing identifies immunotherapy persister cells following PD-1 blockade. J Clin Invest. 131:e1350382021. View Article : Google Scholar : PubMed/NCBI | |
|
Liu X, Xia S, Zhang Z, Wu H and Lieberman J: Channelling inflammation: Gasdermins in physiology and disease. Nat Rev Drug Discov. 20:384–405. 2021. View Article : Google Scholar : PubMed/NCBI | |
|
Kim MS, Lebron C, Nagpal JK, Chae YK, Chang X, Huang Y, Chuang T, Yamashita K, Trink B, Ratovitski EA, et al: Methylation of the DFNA5 increases risk of lymph node metastasis in human breast cancer. Biochem Biophys Res Commun. 370:38–43. 2008. View Article : Google Scholar : PubMed/NCBI | |
|
Rogers C, Fernandes-Alnemri T, Mayes L, Alnemri D, Cingolan G and Alnemri ES: Cleavage of DFNA5 by caspase-3 during apoptosis mediates progression to secondary necrotic/pyroptotic cell death. Nat Commun. 8:141282017. View Article : Google Scholar : PubMed/NCBI | |
|
Wang Y, Gao W, Shi X, Ding J, Liu W, He H, Wang K and Shao F: Chemotherapy drugs induce pyroptosis through caspase-3 cleavage of a gasdermin. Nature. 547:99–103. 2017. View Article : Google Scholar : PubMed/NCBI | |
|
Lee KM, Guerrero-Zotano AL, Servetto A, Sudhan DR, Lin CC, Formisano L, Jansen VM, González-Ericsson P, Sanders ME, Stricker TP, et al: Proline rich 11 (PRR11) overexpression amplifies PI3K signaling and promotes antiestrogen resistance in breast cancer. Nat Commun. 11:54882020. View Article : Google Scholar : PubMed/NCBI | |
|
Vanhaesebroeck B, Perry MWD, Brown JR, André F and Okkenhaug K: PI3K inhibitors are finally coming of age. Nat Rev Drug Discov. 20:741–769. 2021. View Article : Google Scholar : PubMed/NCBI | |
|
Penning TM and Byrns MC: Steroid hormone transforming aldo-keto reductases and cancer. Ann N Y Acad Sci. 1155:33–42. 2009. View Article : Google Scholar : PubMed/NCBI | |
|
He S, Chu X, Wu Y, Jiang J, Fang P, Chen Y, Liu Y, Qiu Z, Xiao Y, Li Z, et al: Development of Biaryl-containing Aldo-Keto Reductase 1C3 (AKR1C3) inhibitors for reversing AKR1C3-mediated drug resistance in cancer treatment. J Med Chem. 14:9537–9560. 2023. View Article : Google Scholar : PubMed/NCBI | |
|
Liu Y, Chen Y, Jiang J, Chu X, Guo Q, Zhao L, Feng F, Liu W, Zhang X, He S, et al: Development of highly potent and specific AKR1C3 inhibitors to restore the chemosensitivity of drug-resistant breast cancer. Eur J Med Chem. 247:1150132023. View Article : Google Scholar : PubMed/NCBI | |
|
Borden EC: Interferons α and β in cancer: Therapeutic opportunities from new insights. Nat Rev Drug Discov. 18:219–234. 2019. View Article : Google Scholar : PubMed/NCBI | |
|
Cheon H, Wang Y, Wightman SM, Jackson MW and Stark GR: How cancer cells make and respond to interferon-I. Trends Cancer. 9:83–92. 2023. View Article : Google Scholar : PubMed/NCBI | |
|
Doherty MR, Cheon H, Junk DJ, Vinayak S, Varadanc V, Telli ML, Ford JM, Stark GR and Jackson MW: Interferon-beta represses cancer stem cell properties in triple-negative breast cancer. Proc Natl Acad Sci USA. 114:13792–13797. 2017. View Article : Google Scholar : PubMed/NCBI | |
|
Diamond M and Farzan M: The broad-spectrum antiviral functions of IFIT and IFITM proteins. Nat Rev Immunol. 13:46–57. 2013. View Article : Google Scholar : PubMed/NCBI | |
|
Moy B, Rumble RB, Come SE, Davidson NE, Di Leo A, Gralow JR, Hortobagyi GN, Yee D, Smith IE, Chavez-MacGregor M, et al: Chemotherapy and targeted therapy for patients with human epidermal growth factor receptor 2-negative metastatic breast cancer that is either endocrine-pretreated or hormone receptor-negative: ASCO guideline update. J Clin Oncol. 39:3938–3958. 2021. View Article : Google Scholar : PubMed/NCBI | |
|
Cheon H, Holvey-Bates EG, McGrail DJ and Stark GR: PD-L1 sustains chronic, cancer cell-intrinsic responses to type I interferon, enhancing resistance to DNA damage. Proc Natl Acad Sci USA. 118:e21122581182021. View Article : Google Scholar : PubMed/NCBI | |
|
Wang Z, Qin J, Zhao J, Li J, Li D, Popp M, Popp F, Alakus H, Kong B, Dong Q, et al: Inflammatory IFIT3 renders chemotherapy resistance by regulating post-translational modification of VDAC2 in pancreatic cancer. Theranostics. 10:7178–7192. 2020. View Article : Google Scholar : PubMed/NCBI | |
|
Santos BF, Grenho I, Martel PJ, Ferreira BI and Link W: FOXO family isoforms. Cell Death Dis. 14:7022023. View Article : Google Scholar : PubMed/NCBI | |
|
Qian P, Zuo Z, Wu Z, Meng X, Li G, Wu Z, Zhang W, Tan S, Pandey V, Yao Y, et al: Pivotal role of reduced let-7g expression in breast cancer invasion and metastasis. Cancer Res. 71:6463–6474. 2011. View Article : Google Scholar : PubMed/NCBI |