Peripheral biomarkers predict survival in patients with glioblastoma treated with temozolomide
- Authors:
- Published online on: April 17, 2025 https://doi.org/10.3892/mco.2025.2851
- Article Number: 56
-
Copyright: © Zhang et al. This is an open access article distributed under the terms of Creative Commons Attribution License.
Abstract
Introduction
Grade 4 gliomas are among the most common and aggressive brain tumors. Astrocytoma, IDH-mutant, grade 4 and glioblastoma (GBM) (IDH wt) carry a poor prognosis, with a median survival of 15 months and a 5-year overall survival less than 10% (1). To date, prognosis is known to be governed by age, Karnofsky performance score, extent of surgery and functional status (2-4). Molecular alterations have also been important prognostic factors in glioblastoma, including isocitrate dehydrogenase 1 and 2 (IDH1/2) oncogenic mutations, O6-methylguanine-DNA methyltransferase (MGMT) promoter methylation, TERT promoter mutations and EGFR amplification (5,6). Currently, the standard treatment is maximal safe resection followed by 30 times 2 Gray daily fractionated intensity-modulated radiation therapy (IMRT) or volumetric arc therapy (VMAT) with 6 weeks of daily temozolomide (TMZ) 75 mg/m2 per day and further followed by at least six cycles of daily TMZ (150 or 200 mg/m2) for five consecutive days (1). TMZ is an alkylating agent that induces cell cycle arrest and apoptosis (7). Exposure to this drug results in DNA adducts, mostly O6-methylguanine (O6-meG). MGMT is capable of repairing O6-meG. MGMT promoter methylation reduces expression and increases cytotoxic effects of TMZ (6,8). As glioblastoma cells spend little time in the G1 phase of the cell cycle, there is insufficient repair, allowing lethal mutations to accumulate (9). However, TMZ is not without side effects, particularly myelosuppression (10-12). Myelosuppression may be an indirect biomarker of DNA repair activity including MGMT promoter methylation. TMZ dose adjustment based on MGMT promoter methylation has been proposed (6), but remains untested in a clinical trial. A number of prior studies suggest increased toxicity may reflect increased drug efficacy and treatment effect, resulting in increased progression-free survival (13,14). Reports in the last decade focused on the effect of myelosuppression in astrocytoma, IDH-mutant, grade 4 and GBM (IDH wt) patients treated with TMZ as it relates to survival outcomes, including decreased leukopenia, neutropenia, and thrombocytopenia (15,16). Our group previously found that leukopenia development during TMZ treatment was associated with increased survival independent of age or extent of surgery compared to those who did not develop leukopenia (17). This and other similar studies have been limited by the number of patients enrolled. We sought to expand the sample size and to identify prognostic biomarkers that may predict outcomes in patients undergoing treatment for glioblastoma. The use of peripheral blood cell counts is an area of active investigation due to the effect of TMZ on dividing cells and, in particular, due to the ease of monitoring in clinical settings. This study combined cohorts from two institutions, expanding the number of patients compared to previously published papers. Our hypothesis is that peripheral blood cell counts can identify target cell counts that will help stratify patients who are likely to respond to treatment and can potentially aid in TMZ dosing.
Materials and methods
Patients
We conducted a retrospective analysis of patients who underwent treatment for histologically confirmed glioblastoma (2016 WHO classification) at the Beth Israel Deaconess Medical Center (BIDMC) between January 2018-November 2021. Given all data cohorts were collected prior to the 2021 WHO Classification of Tumors of the Central Nervous System (CNS) re-classification (Glioblastoma, IDH-wild type and astrocytoma, IDH-mutant, CNS WHO grade 4), patients were diagnosed with glioblastoma based on the 2016 tumor classification (Glioblastoma, IDH-wild type and Glioblastoma, IDH-mutant). Glioblastoma, IDH-wild type will be notated as GBM (IDH wt), as above; and, ‘Glioblastoma, IDH-mutant’ based upon the 2016 WHO guidelines will be noted here as the updated nomenclature of astrocytoma, IDH-mutant, grade 4 based upon the 2021 guidelines. All patients who were exposed to TMZ were included, e.g. concurrent or adjuvant TMZ and those without treatment completion. Patients without known outcomes, or who were lost to follow-up, were excluded. Patients who were still alive by September 2022 at the time of data collection were censored. After exclusion criteria, 36 patients remained. Clinical data and outcomes including age, sex, extent of surgical resection (classified as biopsy, partial resection, and complete resection), chemotherapy treatment, and radiation dose, were recorded. Molecular markers including IDH1 R132H and methylguanine-DNA methyltransferase (MGMT) promoter methylation status were collected. This data was combined with previously published data collected at BIDMC between January 2012 and December 2017 from a similarly screened cohort of patients published in 2020, in which 141 patients were studied (17). This data was also combined with Massachusetts General Hospital (MGH) data collected from 86 patients diagnosed with glioblastoma (2016 WHO classification) between 2007 and 2014. The results of this study were published in 2017(15). These patients were treated with at least 6 cycles of monthly TMZ. In total, 263 patients were included in the current analysis. This study was approved by the BIDMC Institutional Review Board for all activities. The authors declare that they have no competing interests.
Data collection and statistical analysis
Data from the above cohorts were pooled and analyzed together. In this expanded pool of patients, we used similar methods compared with our previous paper (15) as described in the following. The primary endpoint was overall survival (OS), and the secondary endpoint was progression free survival (PFS). OS was measured from the date of diagnosis to the date of death, and PFS from the date of diagnosis to the date of progression as determined by MRI imaging. In addition, baseline complete blood cell counts including white blood cell, absolute neutrophil count, absolute lymphocyte count, red blood cell, hemoglobin, and platelet count were recorded from the first set of such blood values immediately prior to initiation of any TMZ. Lab values from these time points are referred to as ‘baseline’ or ‘prior to treatment’ in this study. The lowest or ‘nadir’ lab values of leukopenia, lymphopenia, neutropenia and thrombocytopenia during the patient's TMZ treatment course were also recorded. These lab values are referred to as ‘during treatment’ results in this study. The severity of nadir leukopenia, lymphopenia, neutropenia and thrombocytopenia during treatment were graded based on the National Cancer Institute's Common Terminology Criteria for Adverse Events (CTCAE version 5.0). Kaplan-Meier analysis with log rank and Cox multivariate proportional hazards analysis were performed using R (R version 4.2.2, R Foundation, Vienna, Austria; ‘survival’ library version 3.5-8; ‘survminer’ library version 0.4.9), using similar methods compared to our group's previous paper (17). Unique to this study, we extended the analysis to include other types of cytopenia, such as lymphopenia, neutropenia, anemia, and thrombocytopenia. A likelihood ratio test was performed. Overall survival vs. each cytopenia in Fig. 1, Fig. 2, Fig. 3 and Fig. 4 were performed using ggsurvplot in R ‘survminer’ package above. P-values were calculated using the survdiff function and ggsurvplot, which use the log rank test. In addition to the analysis above, we also additionally performed regression graphs, which is unique to this report and was not performed in our previous study (17). Line graphs in Fig. 5 were performed using ggplot in ‘ggplot2’ library version 3.4.1 which calculates regression lines. Analysis of each table and figure used pooled, raw data from (15,17), and the 36 patients collected between January 2018-November 2021 as noted above. Variables chosen for multivariate analysis were based on statistical significance in univariate analysis. De-identified patient data is available for download by request. All reported P-values were 2-sided, and statistical significance was considered as P<0.05.
Results
Patient characteristics
In total, 263 patients with biopsy-proven glioblastoma (2016 WHO classification) exposed to TMZ at two institutions were included in this analysis. Of the total number of patients, the average age at the time of diagnosis was 58 years of age; 50.5% of patients were female and 49.5% of patients were male (Table I). The median OS for all patients was 27.9 months and median PFS was 13.8 months. Of note, MGH progression free survival average (months) was almost twice as long as the BIDMC cohort and overall survival a couple months longer. The percentage of patients who received biopsy (27.1%), partial resection (21.4%), and total resection (51.4%) at BIDMC are listed in Table I. 61% of patients treated at BIDMC completed treatment. We did not have completion rate data for patients treated at MGH. Of the patients treated at both BIDMC and MGH, 26% of patients developed leukopenia; 59% developed lymphopenia, 64% developed thrombocytopenia, and 11% developed neutropenia (Table I).
Patient factors associated with survival
Kaplan-Meier with log rank analysis revealed that age <65 was significantly associated with increased OS and PFS. Median OS in patients <65 years old was 24.8 months compared to 19.0 months in patients >65 years old at the time of diagnosis (P=2e-04; Table II). Median PFS was 11.1 months in those <65 years old and 11.0 months in those >65 years old (P=0.03; Table II). Gender was not significantly associated with OS or PFS, however, female sex showed a minimal trend towards increased OS. Median OS for men was 21.0 months compared to women median OS with 22.9 months (P=0.30; Table II). We also did not observe a difference in PFS in men compared to women (P=0.07; Table II). Consistent with prior literature, IDH-wild type status was associated with worse PFS (P=6e-05; Table II) and OS (P=1e-04; Table II), while MGMT promoter methylation was associated with improved PFS (P=0.004; Table II) and OS (P=0.002; Table II).
Correlation of blood counts with survival
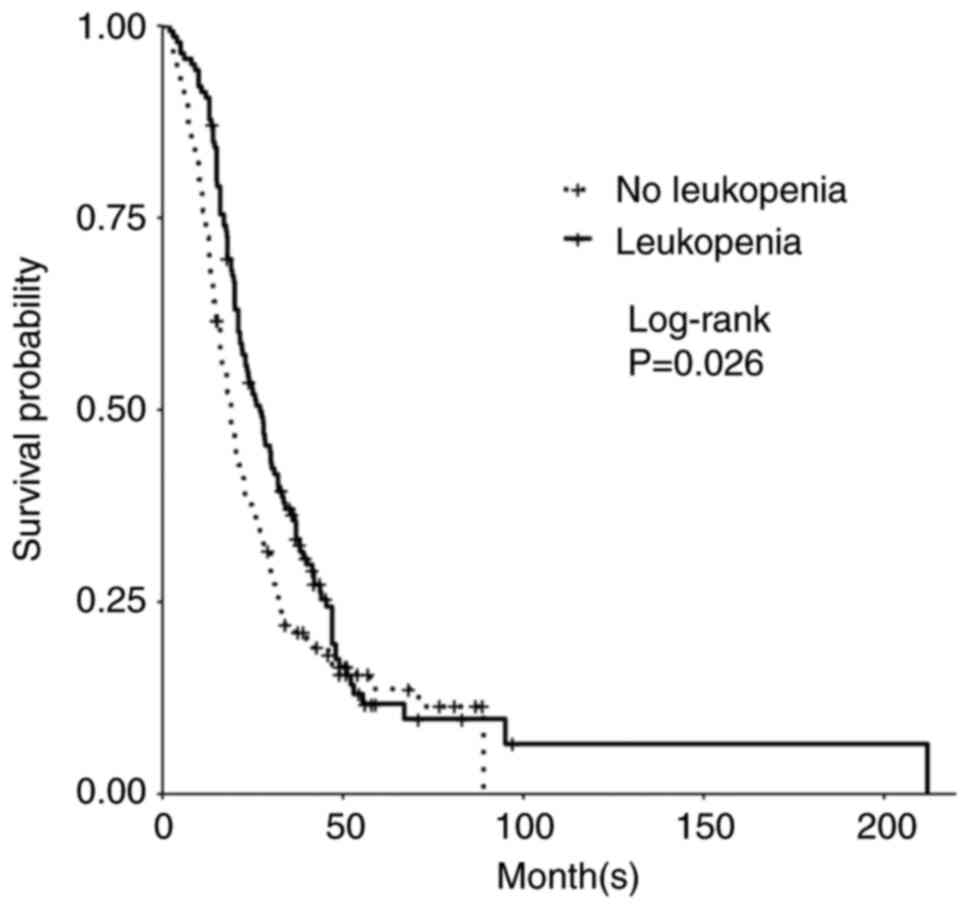
Development of leukopenia in patients treated with TMZ was associated with a significant increase in PFS and OS. In patients with leukopenia (defined as <4.0 K/µl), median PFS was 13.0 months for patients who developed leukopenia vs. 9.6 months for those patients who did not develop leukopenia (P=0.008; Table II). Median OS was 27.0 months in those with leukopenia compared to 19.0 months in those without leukopenia (P=0.03; Table II; Fig. 1). Of the patients who developed leukopenia, those who specifically developed grade 2 leukopenia compared to all others had significantly longer PFS and trended toward longer OS. Median PFS with grade 2 leukopenia was 19.2 months (P=0.005; Table III) while median OS in patients with grade 2 leukopenia was 30.3 months (P=0.06; Table III). Grade 3 leukopenia trended toward shorter OS with a median OS of 16.0 months (P=0.7; Table III). We did not find significant differences in OS between subgroups of patients with decreased white blood cell counts when the data were stratified by CTCAE grade (grades 0-4; Table III), however there were significant differences in PFS between the subgroups (P=0.02; Table III). When stratified by mild (grade 1-2) vs. severe (grade 3-4) leukopenia vs. no leukopenia, there was significantly improved PFS for mild leukopenia when compared to severe leukopenia or no leukopenia (P=0.03; Table III). While not significant, mild leukopenia trended towards longer OS, with a median OS of 27.5 months compared to 19.0 months in those without leukopenia and 20.3 months in those with severe leukopenia (P=0.30; Table III).
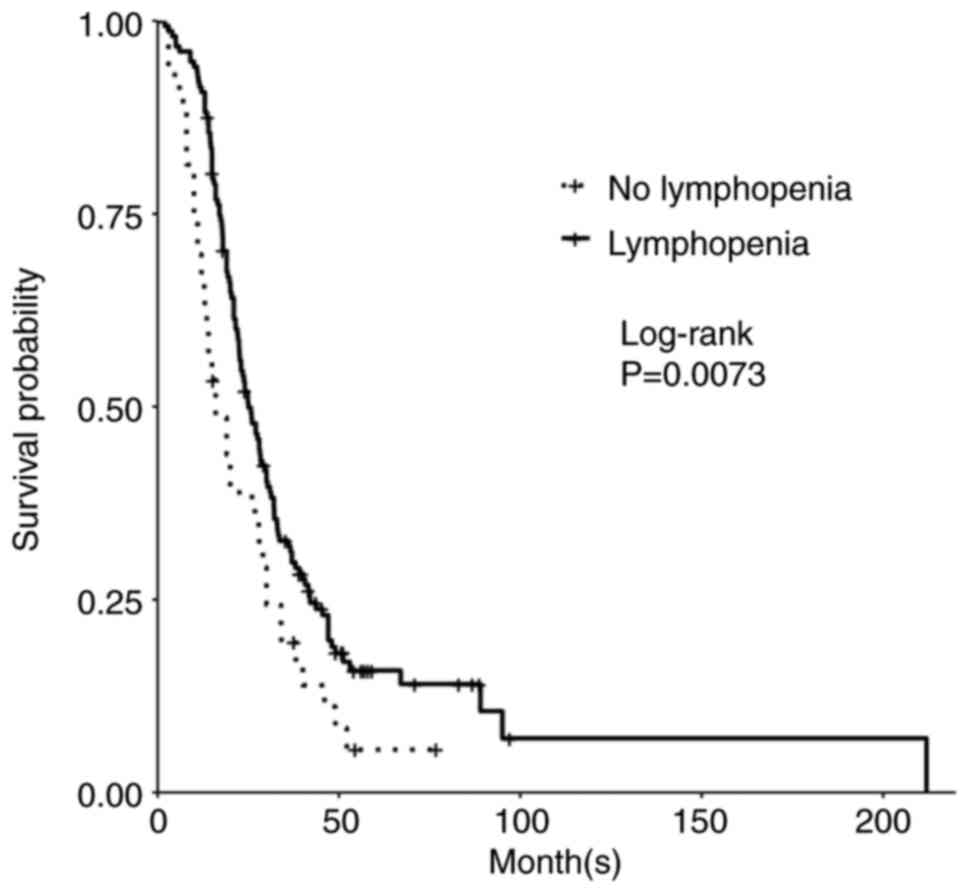
Additionally, development of lymphopenia (defined as <1.2 K/µl) during TMZ treatment was associated with improved PFS and OS. The median PFS of those who developed lymphopenia was 12.6 months compared to 9.0 months for patients who did not develop lymphopenia (P=0.05; Table II). Significantly, the median OS of those who developed lymphopenia was 25.0 months compared to 16.0 months for patients who did not develop lymphopenia (P=0.007; Table II; Fig. 2). Upon subgroup analysis (grade 0-4), grade 2 lymphopenia was significant for longer PFS, while OS trended toward such an increase. Median PFS for grade 2 lymphopenia was 16.0 months (P=0.01; Table III) and OS was 25.8 months (P=0.40, Table III). Grade 4 lymphopenia trended towards decreased PFS and OS at 11 months (P=0.10; Table III) and 20.0 months (P=0.90; Table III) respectively. There was a significant difference between mild lymphopenia (grade 1-2) vs. severe lymphopenia (grade 3-4) vs. no lymphopenia for PFS (P=4e-04; Table III). While OS was not statistically significant, mild lymphopenia also trended towards improved OS with a median of 24.8 months compared to severe lymphopenia at 23.0 months and no lymphopenia at 21.0 months (P=0.20; Table III).
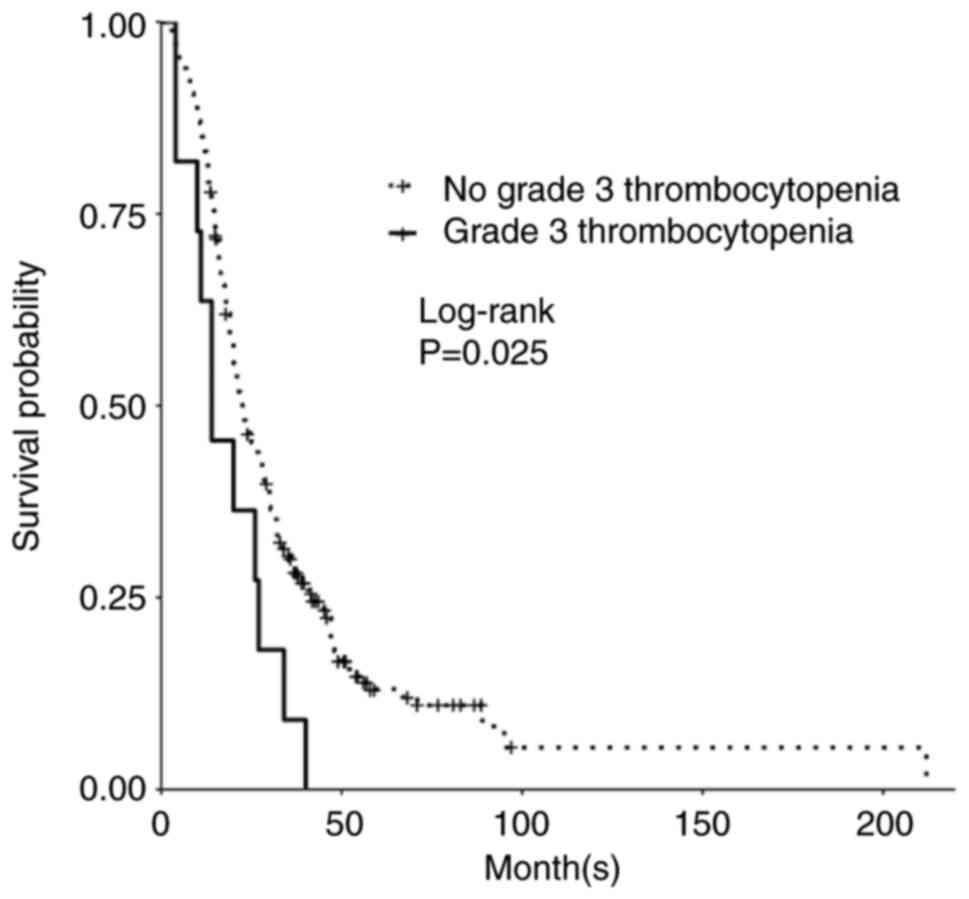
While patients who developed thrombocytopenia (defined as <150 K/µl) did not have a significant change in OS or PFS, there was significant decrease in PFS and OS in those who developed grade 3 thrombocytopenia upon subgroup analysis. Those who developed grade 3 thrombocytopenia had a significant decrease in median PFS to 6 months (P=0.01; Table III) and a median OS of 14 months (P=0.02; Table III; Fig. 3). There was no significant difference between mild thrombocytopenia (grade 1-2) vs. severe thrombocytopenia (grade 3-4) vs. no thrombocytopenia for PFS (P=0.07; Table III) or OS (P=0.40; Table III).
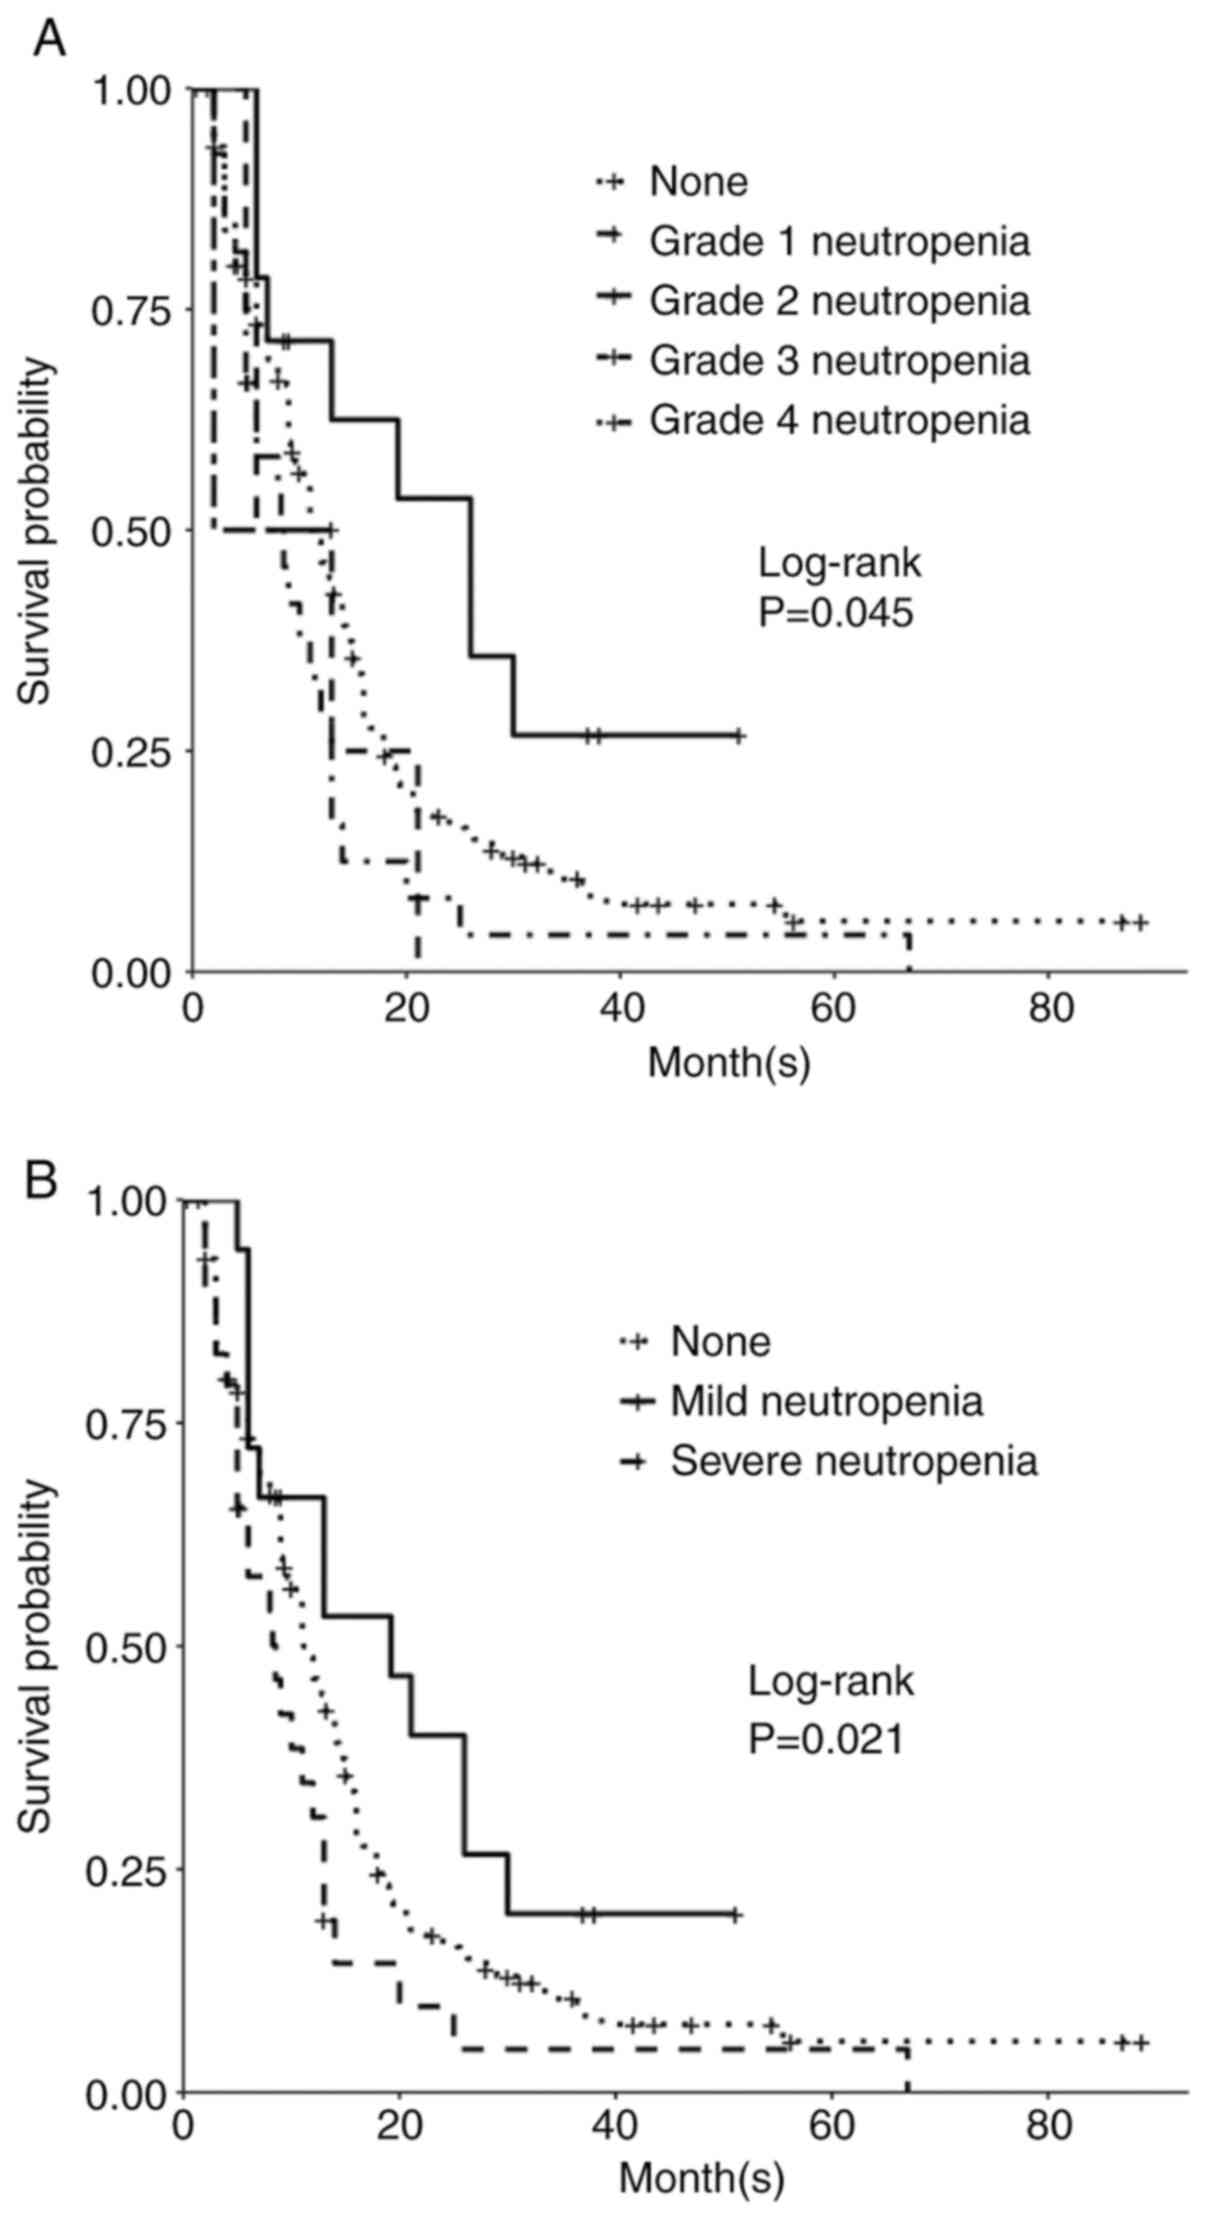
Patients who developed neutropenia (defined as <1.6 K/µl) during TMZ exposure did not have significant change in OS or PFS. However, subgroup analysis (grade 0-4) was associated with significantly different PFS (P=0.05; Table III). Patients who developed grade 2 neutropenia, compared to patients who did not, had improved PFS. The median PFS of those who developed grade 2 neutropenia was 26.0 months (P=0.05; Table III; Fig. 4A). However, those who developed grade 4 neutropenia had worse PFS, with a median of 8.0 months (P=0.02; Table III; Fig. 4). While those patients who developed grade 3 neutropenia had an even lower median PFS of 2.0 months, the number of people in this group was 2, and this was not statistically significant (P=0.80; Table III). The analysis of neutropenia subgroup effect on OS was not statistically significant (P=0.10), however OS trended similarly as PFS. OS of those who developed neutropenia grade 2 was 36.0 months (P=0.10; Table III). Upon analysis of no development of neutropenia vs. mild (grade 1-2) vs. severe (grade 3-4) neutropenia, differences in PFS were significant (P=0.02; Table III; Fig. 4B); the median PFS for mild neutropenia was 19.2 months while severe neutropenia median PFS was 8.53 months. While OS was not significant, this trended similarly; patients who developed mild neutropenia had an OS of 29.9 months vs. the severe neutropenia group OS was 16.0 months.
When we assessed the effect of anemia, there was no significant change in survival. We did not observe any significant change in OS or PFS (P=0.07; Table II).
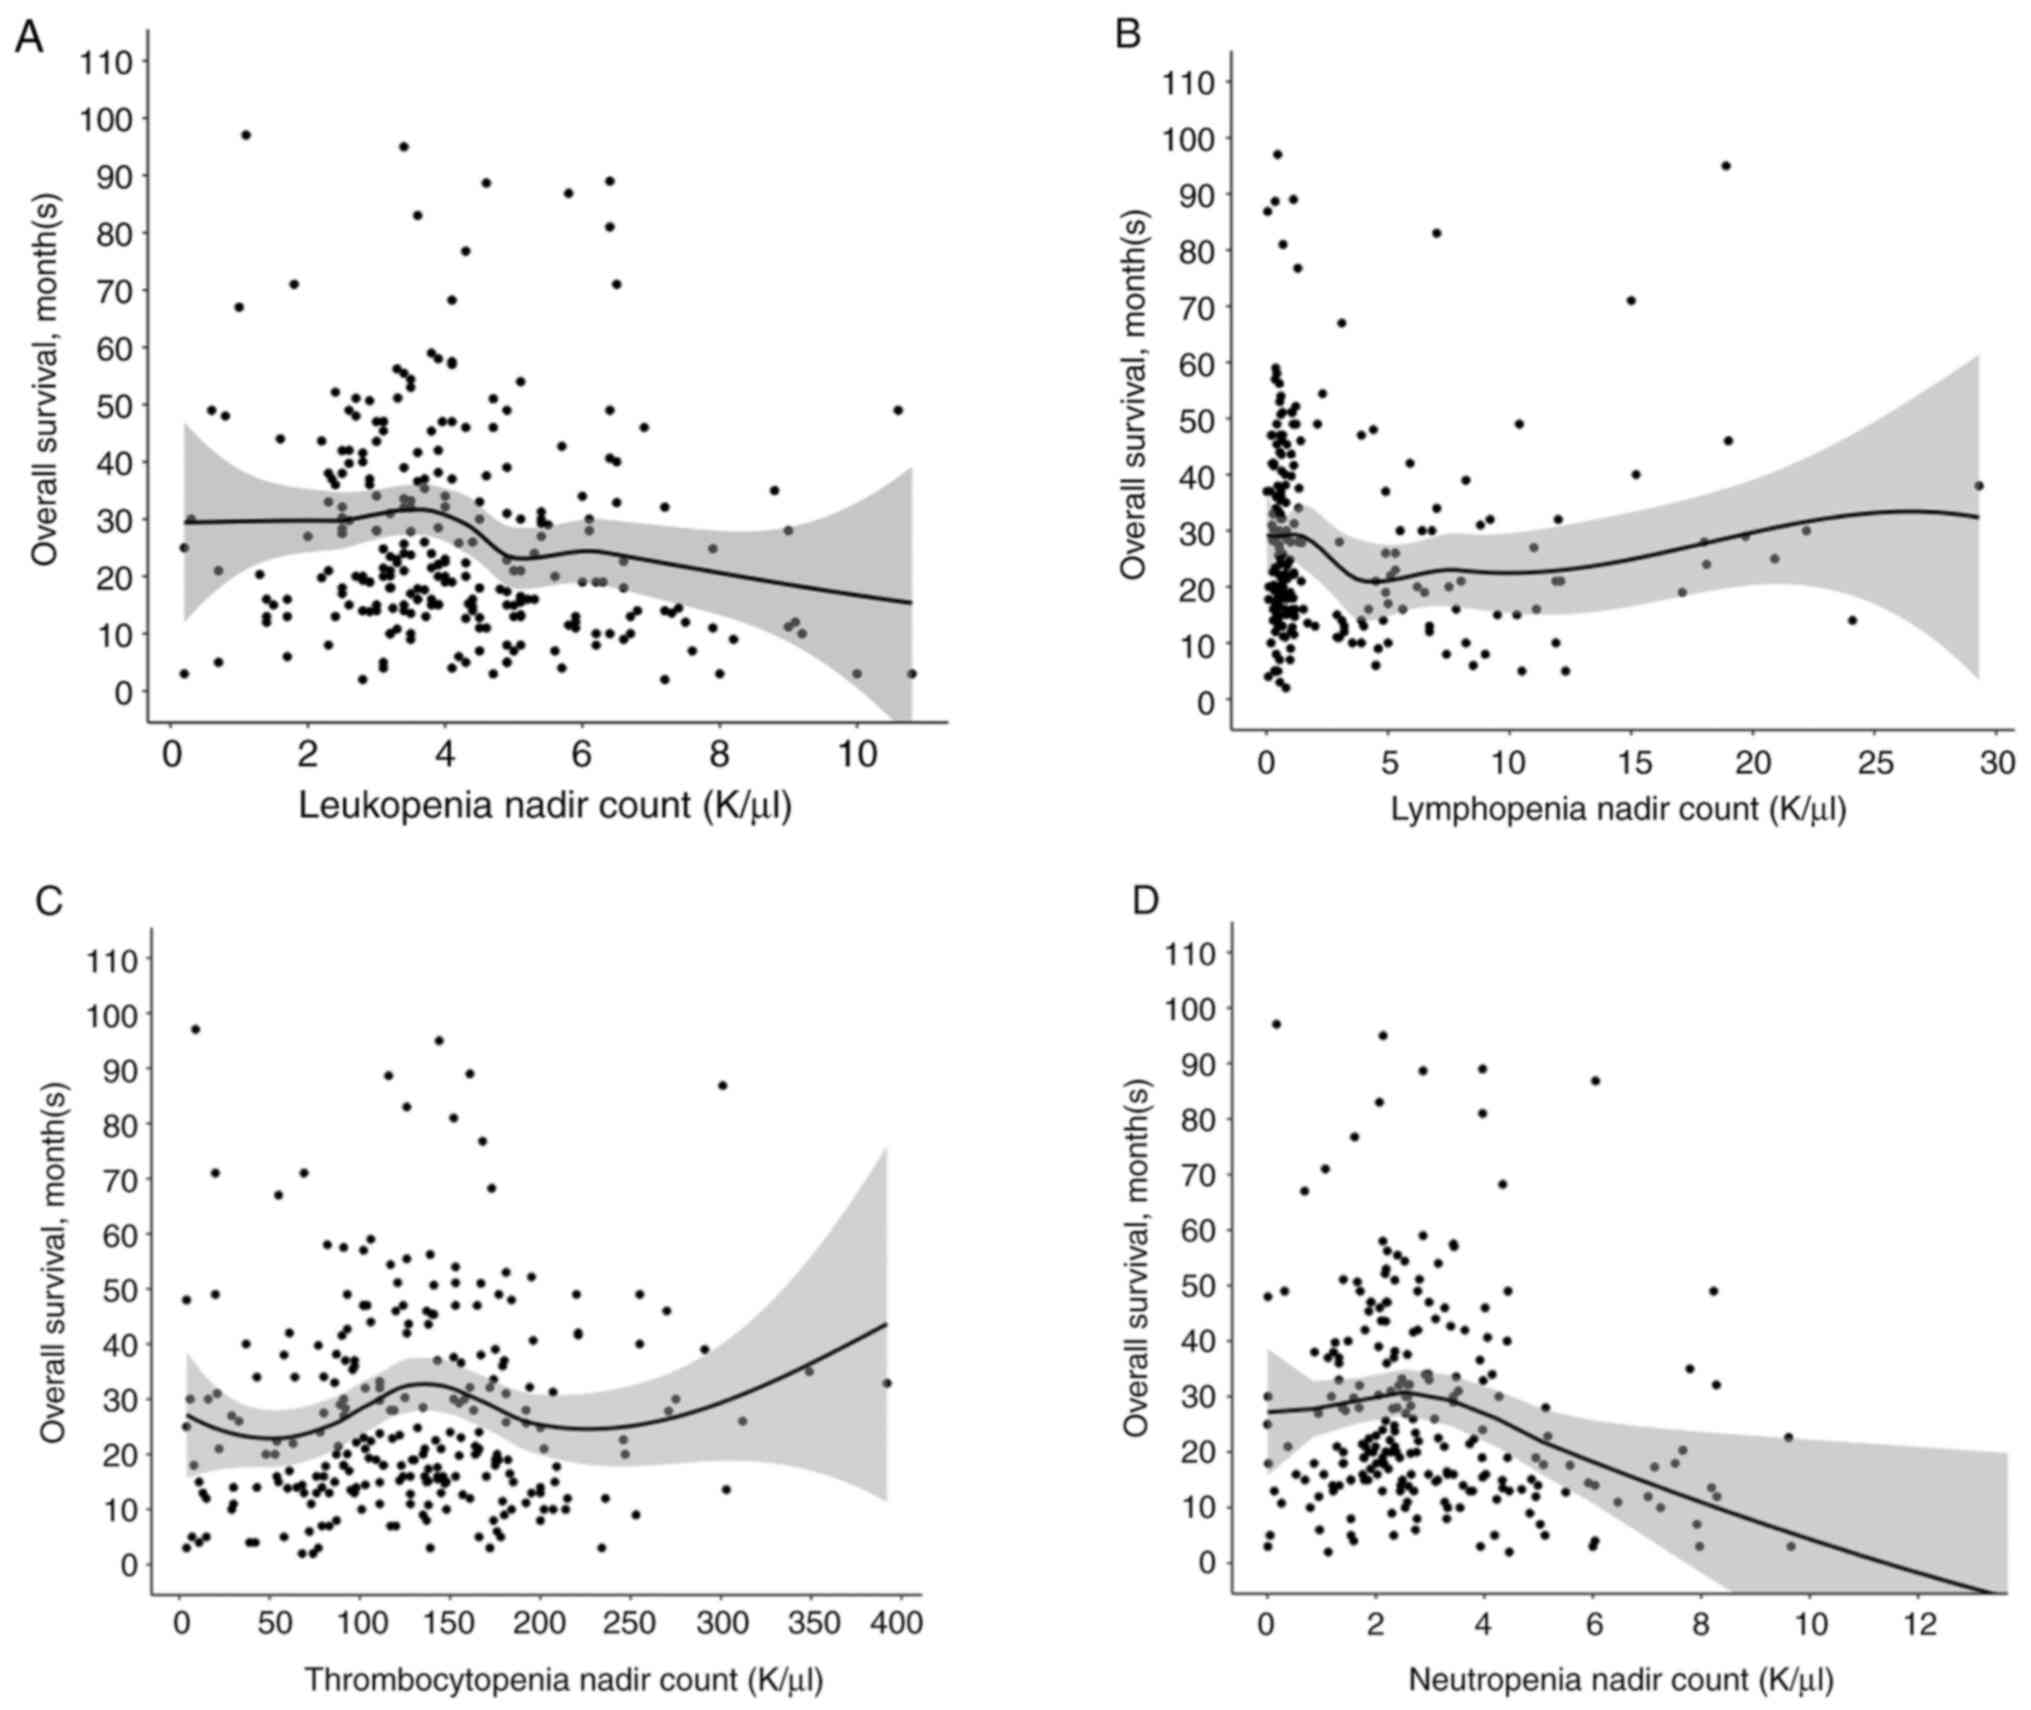
Finally, given the above data in Table III, we evaluated whether overall survival correlated with the degree of cytopenia (leukopenia, lymphopenia, neutropenia and thrombocytopenia) in a linear or non-linear manner. When overall survival is plotted against during treatment nadir values of leukopenia, lymphopenia, thrombocytopenia and neutropenia, none of the curves reveal a linear relationship (Fig. 5). In fact, certain areas along the curve were associated with worse survival, and others improved survival. The leukopenia graph appears to have an associated higher curve and increased OS around leukopenia nadir values around 3-4 K/µl and a positive curve around 6 K/µl, latter which is within the grade 2 leukopenia cut off; however, there is a negative curve and decrease in OS around 5 K/µl, which is the borderline of grade 2 leukopenia based upon CTCAE 5.0 criteria. The thrombocytopenia graph shows a negative curve and worsened OS under thrombocytopenia 50-75 K/µl (latter which correlates with the beginning of grade 1 values based upon CTCAE 5.0 criteria), compared to a more positive curve and higher OS values beginning near the 100-150 K/µl thrombocytopenia nadir values. The lymphopenia curve reveals a more positive curve with lower counts, as does the neutropenia curve, consistent with our Kaplan-Meier analyses using CTCAE criteria.
Relationship between patient factors and survival
Given the significance of leukopenia, lymphopenia, and thrombocytopenia (specifically grade 3) development during TMZ exposure on OS, we evaluated for an association between these factors when compared with one another and known biomarkers IDH and MGMT. Leukopenia development in patients with GBM (IDH wt) was significant for improved PFS and OS. Those with leukopenia development and GBM (IDH wt) had a median OS of 25.0 months vs. 16.0 months in patients with GBM (IDH wt) without development of leukopenia; however, regardless of leukopenia status, the astrocytoma, IDH-mutant, grade 4 group had an improved OS at 57 and 55 months compared to those with GBM (IDH wt) (P=1e-04; Table IV). PFS reflected similar patterns (P=2e-05; Table IV). The development of thrombocytopenia in patients with GBM (IDH wt) was associated with worse overall survival at 19.0 months compared to 21.5 months in patients with GBM (IDH wt) without thrombocytopenia development (P=0.001; Table IV). This pattern was not reflective in the astrocytoma, IDH-mutant, grade 4 group, and the presence of thrombocytopenia was instead correlated with improved PFS and OS (P=0.001; Table IV). Lymphopenia development in patients with GBM (IDH wt) was significant for improved OS at 24.0 months compared to those with GBM (IDH wt) without lymphopenia development at 13.5 median OS months (P=2e-04; Table IV). PFS also reflected a similar pattern, though notably we did not have data regarding lymphopenia development in the astrocytoma, IDH-mutant, grade 4 group due to a high number of censored data points in this group (P=0.002; Table IV). Neutropenia development in patients with GBM (IDH wt) resulted in similar median OS at 20.5 months vs. 20.1 months for those without neutropenia development in patients with GBM (IDH wt); in the astrocytoma, IDH-mutant, grade 4 group, development of neutropenia resulted in a median OS of 57.5 months compared to 29.8 months in those without neutropenia development, suggesting neutropenia may have an additive increase in OS only in this group (P=7e-04).
Leukopenia, lymphopenia, neutropenia and thrombocytopenia were not related to each other with regards to OS. Leukopenia was not always associated with thrombocytopenia. Of the patients with only thrombocytopenia and no associated leukopenia, there was a significant difference in OS of 16.0 months compared to those with only leukopenia and no thrombocytopenia at 31.0 months (P=0.05; Table II). Lymphopenia and leukopenia were also not associated with each other. While patients with lymphopenia and no leukopenia had improved median OS at 22.5 months compared to those without lymphopenia and no leukopenia with a median OS of 14.0 months, those patients who did not develop lymphopenia but only developed leukopenia had an even longer median OS of 30.9 months; more interestingly, those who developed both lymphopenia and leukopenia had median OS of 27.5 months, which is lower than the median OS of leukopenia alone (P=0.007; Table IV). PFS reflected similar patterns (P=0.002; Table IV). Thrombocytopenia and lymphopenia also were not always associated with each other for OS. In patients who developed lymphopenia but no thrombocytopenia, median OS was improved at 26.0 months while patients who developed thrombocytopenia but no lymphopenia, median OS was worse at 14.5 months; both groups were compared to the group of patients who did not develop thrombocytopenia and did not develop lymphopenia in which the median OS was 20.0 months (P=0.01; Table IV). Leukopenia and neutropenia were not clearly related. In those with neutropenia and without leukopenia, median PFS was 9.7 months, while those with leukopenia and no neutropenia had a median PFS of 11.0 months (P=0.007; Table IV). OS trended similarly but was not significant (P=0.07; Table IV).
Effect of baseline cell counts on survival
We also examined the effect of baseline peripheral cell counts prior to any exposure of TMZ on survival. We found a correlation between increased baseline neutrophil counts (defined as absolute neutrophil count ≥10.0 K/µl) and decreased OS and PFS. Those with elevated baseline absolute neutrophil count had a median OS of 16.0 months vs. 24.0 months in those with decreased baseline counts (absolute neutrophil count <10 K/µl; P=0.002; Table V). There was no significant difference in PFS (P=0.2; Table V). However, lower baseline lymphocyte counts (defined as absolute lymphocyte counts <0.7 K/µl) were associated with improved OS. Those patients with lower baseline lymphocyte counts had a median overall survival of 20.3 months vs. those with elevated baseline lymphocyte counts (defined as absolute lymphocyte counts ≥0.7 K/µl) had an OS of 19.0 months (P=0.05; Table V). Those patients with lower baseline lymphocyte counts also had a median PFS of 12.0 vs 9.8 months in those with elevated baseline lymphocyte counts (P=5e-05; Table V). Absolute platelet and white blood cell counts at baseline were not significant (Table V).
Hazard ratio
Multivariate analysis using Cox proportional hazards model revealed that grade 2 leukopenia was associated with improved OS after controlling for other predictors of survival such as age >50 years, sex, IDH1 status, MGMT promoter methylation status, grade 3 thrombocytopenia, grade 1 neutropenia, and lymphopenia [HR=0.2608 (95%CI 0.39-0.99), P=0.00554, Table VI]. The hazard ratio was also significant for age >50 [HR 0.3194 (95% CI 0.13475-0.7573), P=0.00957] and neutropenia grade 1 [HR 68.8210 (95% CI 4.42516-1070.3173), P=0.00251] when taking into account for other predictors of survival, including sex, IDH1, MGMT promoter methylation status, grade 2 leukopenia, and lymphopenia. Likelihood ratio test P=4x10⁻⁶. Factors to control for were chosen if significant on univariate analysis.
Discussion
Peripheral biomarkers can predict response to standard GBM (IDH wt) and astrocytoma, IDH-mutant, grade 4 treatment with TMZ and reflect prognosis of grade 4 glioma. This is especially relevant to patients who could have unique peripheral blood count profiles and will lead to improved clinical management of glioblastoma. Proper identification of patient factors and peripheral biomarkers can ultimately be used to offer prognostic information, much like the IDH1 and MGMT promoter statuses that we discuss in our clinical practice today and help guide treatment. In this study, we explored the effect of TMZ therapy on circulating blood cell counts to determine which peripheral blood count markers can offer prognostic value and help predict clinical outcomes in patients with GBM (IDH wt) and astrocytoma, IDH-mutant, grade 4 gliomas. While other studies have explored this relationship in single institutions (15-17), in this study we combined data from different institutions and significantly expanded the sample size.
Our data reveals that development of leukopenia, during treatment with TMZ (completion or otherwise) is associated with significantly improved OS and PFS. This is consistent with our prior study (17). Compared to our previous study, we have also discovered that the presence of leukopenia is associated with improved OS and PFS in both the GBM (IDH wt) and in the astrocytoma, IDH-mutant, grade 4 group. This further supports leukopenia as an independent prognostic factor for improved survival. Interestingly, univariate subgroup analysis of leukopenia grade 2 revealed a trend towards improved OS compared to those who did not develop grade 2 leukopenia (i.e. development of grade 1, 3 or 4 or no leukopenia). However, leukopenia grade 2 was significantly associated with improved OS upon multivariate analysis and accounting for IDH1, MGMT, grade 3 thrombocytopenia, lymphopenia, grade 1 neutropenia, age, and sex during treatment with TMZ. This has not been shown in previous studies (15,17) and supports evidence that TMZ induced leukopenia grade 2 can be an independent prognostic factor. We therefore were curious to look for particular subsets of leukocyte cells (e.g. neutrophils, lymphocytes) that could be responsible for the leukopenia effect on survival, or if leukopenia may be a separate biomarker.
Development of lymphopenia was also found to be an additional and significant positive prognostic factor with improved PFS and OS, including in GBM (IDH wt). This is consistent with previous studies (18). The association between lymphopenia development and improved PFS and OS is also true in the GBM (IDH wt). On subgroup analysis, grade 2 lymphopenia development during TMZ treatment was significantly associated with increased PFS while OS trended as such. However, higher grades of lymphopenia (grade 3 and 4) trended toward lower OS. Separately, lower baseline lymphocyte counts prior to initiation of TMZ were also significantly associated with improved PFS and OS. Overall, lymphopenia development was suggestive of improved prognosis, before or after TMZ treatment and can serve as a prognostic factor as well. Regulatory T-cells have been associated with immunosuppression and increased in patients with malignant glioma, and have been associated with a decrease in anti-tumor T effector cells (19). It is possible that development of lymphopenia during TMZ treatment is reflective of T regulatory cells being less in number, having less effect on anti-tumor T effector cells and restoring anti-tumor immunosuppressive function; perhaps severe degrees of lymphopenia have complete depletion of all types of T cells, including effector cells, leading to fully suppressed anti-tumor immunosuppression and could also place patients at risk for infections leading to mortality risk. Our study and others have found that lymphopenia can serve as a consistent, positive prognostic biomarker of PFS and OS for patients with GBM (IDH wt) treated with TMZ.
Neutropenia grade 2 as well as mild neutropenia development during TMZ treatment were significant for increased PFS, while higher grades and severe neutropenia were associated with decreased PFS. The OS trended similarly. These findings are reflective of other studies (16,18), one of which showed that a 40% decrease in neutrophil counts during treatment with TMZ correlated significantly with OS in patients with glioblastoma (16). While interestingly neutropenia grade 1 on multivariate analysis was significant for what seemed to be lower OS when adjusting for other factors such as age, sex, IDH and MGMT promoter methylation status, this should be interpreted with caution as 4 patients fell into this category. Further, elevated baseline absolute neutrophil counts (≥10.0 K/µl) prior to TMZ treatment were associated with worse OS. This is reflective of findings seen in prior studies in which increased neutrophils counts are associated with worse survival (15,18). Our findings and prior studies suggest that an inflammatory state prior to treatment is reflective of poor prognosis, and lower neutrophil counts during treatment reflect a less inflammatory state, which is a positive prognostic factor. Increased neutrophils at baseline appears to be a poor prognostic factor, while neutropenia development during TMZ treatment is a consistent biomarker for positive prognosis in patients with GBM (IDH wt) or astrocytoma, IDH-mutant, grade 4.
Interestingly, we found that those who had leukopenia without lymphopenia had significantly longer OS than those who had lymphopenia without leukopenia. Further, those who had both leukopenia and lymphopenia did not have similar OS as those with leukopenia or have a synergistic positive affect on OS; rather, the median OS for those who developed both leukopenia and lymphopenia was lower than the median OS of leukopenia alone. Neutropenia without leukopenia had a significantly lower median PFS than leukopenia without neutropenia, and OS trended as such as well. However, the presence of neutropenia and leukopenia, together had the highest median PFS and OS. Taken together, this suggests that the development of leukopenia is a stronger prognostic factor compared to lymphopenia or neutropenia alone. Leukopenia after TMZ exposure may be a direct effect of DNA alkylation but other mechanisms are also possible, such as lymphocyte redistribution after increased tumor antigen exposure or a direct effect of TMZ on the tumor microenvironment. There may also be another, yet unidentified subset of leukocytes that may be causative.
We found that the presence of thrombocytopenia grade 3 was associated with worse PFS and OS, a result not previously reported. For patients with GBM (IDH wt), the presence of any thrombocytopenia resulted in significantly worse PFS and OS. In a previous study, decreased platelet count from baseline during concomitant radiotherapy and TMZ was associated with prolonged survival (20), which we did not find in our study. Thrombocytosis can occur in patients with malignant glioma and may lead to complications and increased mortality (21). Alternatively, thrombocytopenia and poor survival in our study may reflect dose-limitations of TMZ during the chemotherapy course leading to poor outcomes. The data suggest that thrombocytopenia in our patient cohort is a marker for poor prognosis during TMZ treatment. The opposed effects of leukopenia and thrombocytopenia on outcomes suggests that TMZ exposure may result in a leukocyte predominant vs. platelet predominant bone marrow effect. This may serve as evidence for using such target blood counts to potentially aid in adequate TMZ dosing for each individual.
These findings may have clinical implications. Much like IDH, MGMT and other important factors such as Karnofsky Performance Scale and age, we have identified and found supportive evidence of using peripheral blood counts as important biomarkers for prognostication in patients with GBM (IDH wt) and astrocytoma, IDH-mutant, grade 4 treated with TMZ. Future applications include providing a simple feedback tool to optimize treatment, and aid discussion of prognosis. Limitations of this study include the use of two patient cohorts with some variation in PFS and OS. This may be due to the special patient cohorts at BIDMC and MGH, in which many of them go on to clinical trials and may not reflect the typical patient in the community. Further, eosinophils, basophils, or monocytes were not collected for the patient cohort at BIDMC, which may also be important in explaining leukopenia etiology. We did not collect corticosteroid exposure data in this cohort. Notably, corticosteroid exposure and treatment are difficult to assess as patients are treated at different time points and at different degrees based upon their range of symptoms and clinical course.
In conclusion, we have identified lower baseline lymphocyte counts prior to TMZ treatment, as well as during treatment leukopenia, lymphopenia, and mild neutropenia development during TMZ exposure in GBM (IDH wt) and astrocytoma, IDH-mutant, grade 4 as positive peripheral prognostic biomarkers, while increased baseline neutrophil counts prior to TMZ treatment and grade 3 thrombocytopenia development during TMZ exposure are poor prognostic peripheral biomarkers. Further research must be done to elucidate the exact mechanisms to further understand and treat glioblastomas more effectively.
Acknowledgements
Not applicable.
Funding
Funding: No funding was received.
Availability of data and materials
The data generated in the present study may be requested from the corresponding author.
Authors' contributions
SZ, NM and EJU conceived and designed the study. SZ, NM, MM, ST, KWGH and EJU acquired data. SZ and NM performed statistical analysis. SZ, NM and EJU drafted the manuscript. SZ, NM, KWGH and EJU interpreted and critically revised the manuscript. All authors reviewed the submitted version of the manuscript. SZ and EJU approved the final version of the manuscript on behalf of all authors. SZ and EJU confirm the authenticity of all the raw data. EJU supervised the study. All authors read and approved the final manuscript.
Ethics approval and consent to participate
The study was exempt from obtaining informed consent as it was deemed to be of minimal risk to participants given the retrospective design and de-identification of clinical information. The present retrospective review was approved by the Institutional Review Board at Beth Israel Deaconess Medical Center (Boston, MA, USA) with protocol no. 2017P000635.
Patient consent for publication
Not applicable.
Competing interests
The authors declare that they have no competing interests.
References
|
Stupp R, Mason WP, van den Bent MJ, Weller M, Fisher B, Taphoorn MJ, Belanger K, Brandes AA, Marosi C, Bogdahn U, et al: Radiotherapy plus concomitant and adjuvant temozolomide for glioblastoma. N Engl J Med. 352:987–996. 2005.PubMed/NCBI View Article : Google Scholar | |
|
Buckner JC: Factors influencing survival in high-grade gliomas. Semin Oncol. 30 (6 Suppl 19):S10–S14. 2003.PubMed/NCBI View Article : Google Scholar | |
|
Barnholtz-Sloan JS, Williams VL, Maldonado JL, Shahani D, Stockwell HG, Chamberlain M and Sloan AE: Patterns of care and outcomes among elderly individuals with primary malignant astrocytoma. J Neurosurg. 108:642–648. 2008.PubMed/NCBI View Article : Google Scholar | |
|
Scott JG, Bauchet L, Fraum TJ, Nayak L, Cooper AR, Chao ST, Suh JH, Vogelbaum MA, Peereboom DM, Zouaoui S, et al: Recursive partitioning analysis of prognostic factors for glioblastoma patients aged 70 years or older. Cancer. 118:5595–5600. 2012.PubMed/NCBI View Article : Google Scholar | |
|
Aquilanti E, Miller J, Santagata S, Cahill DP and Brastianos PK: Updates in prognostic markers for gliomas. Neuro Oncol. 20 (Suppl 7):vii17–vii26. 2018.PubMed/NCBI View Article : Google Scholar | |
|
Hegi ME, Diserens AC, Gorlia T, Hamou MF, de Tribolet N, Weller M, Kros JM, Hainfellner JA, Mason W, Mariani L, et al: MGMT gene silencing and benefit from temozolomide in glioblastoma. N Engl J Med. 352:997–1003. 2005.PubMed/NCBI View Article : Google Scholar | |
|
Lee SY: Temozolomide resistance in glioblastoma multiforme. Genes Dis. 3:198–210. 2016.PubMed/NCBI View Article : Google Scholar | |
|
Esteller M, Garcia-Foncillas J, Andion E, Goodman SN, Hidalgo OF, Vanaclocha V, Baylin SB and Herman JG: Inactivation of the DNA-repair gene MGMT and the clinical response of gliomas to alkylating agents. N Engl J Med. 343:1350–1354. 2000.PubMed/NCBI View Article : Google Scholar | |
|
Knizhnik AV, Roos WP, Nikolova T, Quiros S, Tomaszowski KH, Christmann M and Kaina B: Survival and death strategies in glioma cells: Autophagy, senescence and apoptosis triggered by a single type of temozolomide-induced DNA damage. PLoS One. 8(e55665)2013.PubMed/NCBI View Article : Google Scholar | |
|
Gerber DE, Grossman SA, Zeltzman M, Parisi MA and Kleinberg L: The impact of thrombocytopenia from temozolomide and radiation in newly diagnosed adults with high-grade gliomas. Neuro Oncol. 9:47–52. 2007.PubMed/NCBI View Article : Google Scholar | |
|
Gerson SL, Phillips W, Kastan M, Dumenco LL and Donovan C: Human CD34+ hematopoietic progenitors have low, cytokine-unresponsive O6-alkylguanine-DNA alkyltransferase and are sensitive to O6-benzylguanine plus BCNU. Blood. 88:1649–1655. 1996.PubMed/NCBI | |
|
Stokes JE, Bobola MS, Chamberlain MC and Silber JR: Low leukocyte MGMT accompanies temzolomide-induced myelotoxicity in brain tumor patients. J Can Res Updates. 1:44–48. 2012. | |
|
Abola MV, Prasad V and Jena AB: Association between treatment toxicity and outcomes in oncology clinical trials. Ann Oncol. 25:2284–2289. 2014.PubMed/NCBI View Article : Google Scholar | |
|
Di Maio M, Gridelli C, Gallo C, Shepherd F, Piantedosi FV, Cigolari S, Manzione L, Illiano A, Barbera S, Robbiati SF, et al: Chemotherapy-induced neutropenia and treatment efficacy in advanced non-small-cell lung cancer: A pooled analysis of three randomised trials. Lancet Oncol. 6:669–677. 2005.PubMed/NCBI View Article : Google Scholar | |
|
Vaios EJ, Nahed BV, Muzikansky A, Fathi AT and Dietrich J: Bone marrow response as a potential biomarker of outcomes in glioblastoma patients. J Neurosurg. 127:132–138. 2017.PubMed/NCBI View Article : Google Scholar | |
|
Saito T, Sugiyama K, Hama S, Yamasaki F, Takayasu T, Nosaka R, Muragaki Y, Kawamata T and Kurisu K: Prognostic importance of temozolomide-induced neutropenia in glioblastoma, IDH-wildtype patients. Neurosurg Rev. 41:621–628. 2018.PubMed/NCBI View Article : Google Scholar | |
|
Ho KG, Uhlmann EN, Wong ET and Uhlmann EJ: Leukopenia is a biomarker for effective temozolomide dosing and predicts overall survival of patients with glioblastoma. Mol Clin Oncol. 13(80)2020.PubMed/NCBI View Article : Google Scholar | |
|
Le Rhun E, Oppong FB, Vanlancker M, Stupp R, Nabors B, Chinot O, Wick W, Preusser M, Gorlia T and Weller M: Prognostic significance of therapy-induced myelosuppression in newly diagnosed glioblastoma. Neuro Oncol. 24:1533–1545. 2022.PubMed/NCBI View Article : Google Scholar | |
|
Humphries W, Wei J, Sampson JH and Heimberger AB: The role of tregs in glioma-mediated immunosuppression: Potential target for intervention. Neurosurg Clin N Am. 21:125–137. 2010.PubMed/NCBI View Article : Google Scholar | |
|
Williams M, Liu ZW, Woolf D, Hargreaves S, Michalarea V, Menashy R, Kooner I and Wilson E: Change in platelet levels during radiotherapy with concurrent and adjuvant temozolomide for the treatment of glioblastoma: A novel prognostic factor for survival. J Cancer Res Clin Oncol. 138:1683–1688. 2012.PubMed/NCBI View Article : Google Scholar | |
|
Marx S, Xiao Y, Baschin M, Splittstöhser M, Altmann R, Moritz E, Jedlitschky G, Bien-Möller S, Schroeder HWS and Rauch BH: The role of platelets in cancer pathophysiology: Focus on malignant glioma. Cancers (Basel). 11(569)2019.PubMed/NCBI View Article : Google Scholar |