Serum fucosylated receptor expression‑enhancing protein 5 as a biomarker for early stage pancreatic cancer
- Authors:
- Published online on: September 26, 2025 https://doi.org/10.3892/ol.2025.15302
- Article Number: 556
-
Copyright: © Sogawa et al. This is an open access article distributed under the terms of Creative Commons Attribution License.
Abstract
Introduction
Pancreatic ductal adenocarcinoma (PDAC) has a poor prognosis and is a leading cause of cancer mortality (1). Despite improvements in therapy, the estimated 5-year survival rate of PDAC is still only 11%, mainly because the disease is often diagnosed at a very late stage (2); a previous study reported that ~50% of cases were in stage IV at the time of diagnosis. Thus, there is a need to detect PDAC in patients in a presymptomatic state. However, early diagnosis is difficult due to the anatomical characteristics of the pancreas, which is a long and thin organ located dorsal to the stomach and large intestine. This prevents clear images of the entire pancreas being obtained on abdominal ultrasonography (3).
The rate of subjective symptoms (such as weight loss and abdominal pain) in PDAC at stage 0 or I, for which a favorable prognosis can be expected, is only 25%, and the positive rates of common tumor markers such as carcinoembryonic antigen (CEA) and carbohydrate antigen 19-9 (CA19-9) are extremely low in clinical practice (4), resulting in fewer opportunities for referrals to a hospital. The Japanese PDAC database indicates 5-year survival rates with diagnosis at stages 0 (non-invasive), IA and IB of 85.8, 68.7 and 59.7%, respectively (4), but the diagnostic rates at these respective stages are only 1.7, 4.1 and 6.3% (1). Patients with a tumor of ≤10 mm account for only 0.8% of cases (3). Therefore, detection and diagnosis of PDAC at an early stage and earlier use of multidisciplinary therapy, including surgical resection and chemotherapy, are required to improve outcomes.
Identification of biomarkers in extracellular vesicles (EVs), which are small membrane bound vesicles of endocytic origin released by various cell types, is of increasing interest. EVs exhibit pleiotropic functions, including immune response modulation, antigen presentation and intercellular communication (5,6). EVs are surrounded by a lipid bilayer membrane, making them readily accessible, highly stable and an ideal source for discovery of novel biomarkers (7). Thus, biomarkers from EVs have been used to clarify the pathogenesis, diagnosis and therapeutic strategies for several malignant diseases (such as lung, liver and colorectal cancer) (8–11). Also, the dynamic range of blood proteins is extremely wide. If a candidate protein is present only in small amounts, its detection in total blood protein may be challenging, even with use of selected reaction monitoring (SRM) (8). Therefore, EV proteins are promising candidates for biomarkers.
Previous advances in mass spectrometry (MS) have enabled detection and quantification of thousands of proteins in cells, tissues and biological fluids. As a powerful analytical tool, MS has been instrumental in elucidating the fundamental role of EVs in cancer, such as modulating the tumor microenvironment, mediating immune evasion and contributing to metastasis (12,13). MS-based proteomics is also useful for exploring EVs as a source of diagnostic, prognostic (severity of outcome) and predictive (treatment response) biomarkers. Comprehensive shotgun proteomics using data-independent acquisition (DIA) or data-dependent acquisition is commonly used for biomarker discovery. Biomarker candidates identified through comprehensive proteomics can be validated using targeted proteomics approaches, such as SRM or parallel reaction monitoring (8,14–16).
The aim of the present study was to identify and verify a serum EV-based protein biomarker for diagnosis of PDAC using DIA and SRM. To overcome the difficulty of consistent extraction of EVs from large sample sets, a clinically applicable enzyme-linked immunosorbent assay (ELISA) was developed for validation of potential targets in serum.
Materials and methods
Patient serum samples
In the first cohort, blood samples were obtained from 20 patients (mean age, 64±5 years; 12 male and 8 female) with PDAC, 10 with chronic pancreatitis (PT) (mean age, 55±10 years; 6 males and 4 females) and 10 age- and sex-matched healthy volunteers (HVs) as controls (mean age, 60±4 years; 6 males and 4 females). To validate the results, serum levels of candidate proteins were measured in a second cohort of 20 patients with PDAC (mean age, 66±8 years; 12 males and 8 females), 10 with PT (mean age, 56±12 years; 6 males and 4 females) and 10 age- and sex-matched HVs (mean age, 62±6 years; 6 males and 4 females). In a third cohort, blood samples were obtained from 63 patients with PDAC (mean age, 67±9 years; 35 males and 27 females), 10 with PT (mean age, 58±10 years; 6 males and 4 females) and 30 age- and sex-matched HVs (mean age, 62±10 years; 17 males and 13 females). Blood samples were collected at the Department of General Surgery at Chiba University Hospital (Chuo, Japan) between December 2019 and May 2022, from patients who were histologically diagnosed with PDAC or PT. The samples from HVs were collected at the Kashiwado Hospital (Chuo, Japan) between August and December 2015 (Table I). All blood samples were processed according to a standardized protocol (17), and serum aliquots were frozen until subsequent analysis. None of the patients had undergone therapy, such as radiation, chemotherapy or surgery, prior to serum sample collection. The ethics committee at each institution approved the protocols and written informed consent was obtained from all patients and HVs.
Isolation of EVs
EV isolation was performed using a MagCapture Exosome Isolation Kit PS (FUJIFILM Wako Pure Chemical Corporation) (18–20). In short, 200 µl serum was centrifuged at 1,200 × g for 20 min at 4°C. The pre-cleared serum sample was filtered through a 0.45-µm Spin-X centrifuge tube (Corning, Inc.) and incubated with magnetic beads. The beads were washed with PBS, the EVs eluted with 100 µl elution buffer and 80 µl eluate was used for proteomics analysis.
Protein extraction from EVs and digestion
EV samples were lysed to extract proteins using a phase transfer surfactant (PTS) protocol (21). Separated EV fractions were lysed with PTS buffer (12 mM sodium deoxycholate, 12 mM sodium lauroyl sarcosinate, 50 mM ammonium bicarbonate), and boiled for 5 min at 95°C. EV proteins were reduced with 10 mM tris (2-carboxyethyl) phosphine (FUJIFILM Wako Pure Chemical Corporation) for 30 min at 37°C and allowed to cool to room temperature and alkylated with 20 mM iodoacetamide (Nacalai Tesque, Inc.) for 30 min at 37°C in the dark. The mixture was incubated in a final concentration of 21 mM L-cysteine (Nacalai Tesque, Inc.) for 10 min at room temperature. Trypsin and Lys C digestion [1 µl 1.0 µg/µl trypsin solution (Roche Diagnostics) and 2 µl 1 mAU/µl Lys C (FUJIFILM Wako Pure Chemical Corporation)] was performed overnight at 37°C. After surfactant removal, the digested peptides were desalted using StageTips (22).
Liquid chromatography (LC)-MS/MS DIA and data analysis
LC was performed using an UltiMate 3000 Nano LC system (Thermo Fisher Scientific, Inc.) with an HTC-PAL autosampler (CTC Analytics AG) and a trap column for sample injection (0.075×20 mm, Acclaim PepMap RSLC Nano-Trap Column; Thermo Fisher Scientific, Inc.). MS and MS/MS were performed using a Q Exactive hybrid quadrupole-Orbitrap mass spectrometer (Thermo Fisher Scientific, Inc.) with a nano LC-MS interface for peptide ionization using nano-electrospray ionization in positive ion mode (AMR Inc.). Peptides were separated using an analytical column (75 µm × 30 cm) packed in-house with 1.9 µm resin (ReproSil-Pur C18-AQ; Dr. Maisch HPLC GmbH) at a flow rate of 280 nl/min with a 105-min gradient from 5 to 30% solvent B [solvent A, 0.1% formic acid (FA) and 2% acetonitrile; solvent B, 0.1% FA and 90% acetonitrile]. MS data were acquired in DIA mode. Full mass spectra were obtained in the range of 398–802 m/z with the following parameters: Resolution 140,000, AGC target 3×10⁶ ions, maximum injection time 200 ms and normalized collision energy of 27. MS/MS spectra were obtained with the following parameters: 8 m/z isolation window with resolution 70,000, AGC target 3×10⁶ ions, maximum injection time ‘auto’, overlapping window pattern and normalized collision energy of 27.
Raw MS data were analyzed using DIA-NN software (version 1.7.12; Demichev Lab, Department of Biochemistry, Charité Universitätsmedizin). Database searches were performed using the Homo sapiens UniProt database (https://www.uniprot.org/), a contaminant database (23) and a decoy database (created from forward database by DIA-NN) in which all protein sequences were in reverse order. The search parameters were: 7–30 peptide length, carbamidomethyl modification of cysteine residues (+57.021 Da), up to two cleavage sites missing, protein names from FASTA for implicit protein grouping, robust LC (high precision) for quantification strategy and retention time-dependent for cross-run normalization. The false discovery rate (FDR) for precursor ions was set to 1%.
Quantitation of target peptides by SRM using SI-peptide as the internal standard
SRM was performed for quantification of the target peptides, using an HTC-PAL autosampler, a Paradigm MS2 Nano-LC system (Michrom Bioresources, Inc.) and a triple quadrupole mass spectrometer (TSQ-Vantage; Thermo Fisher Scientific, Inc.) as previously described (8). The peptides used for SRM measurements were the two most intense peptides selected from those identified using LC-MS/MS (DIA). SRM transition lists (precursor m/z and product m/z pairs) for each peptide were created using Skyline software (version 20.2) (24) and optimized by monitoring the transitions of the synthetic isotope-labeled-peptide mixture (8,16,25). The transition list is shown in Table II. SI peptides with a C-terminal 15N- and 13C-labeled arginine or lysine (isotopic purity >99%) were obtained from JPT Peptide Technologies (crude purity). An SI peptide mixture was added to the digested EV proteins purified from each serum sample. The amount of SI peptide added was set to be close to the amount of endogenous peptides. Transition peaks obtained using SRM measurements were manually inspected to select peaks with heights ≥1,000, signal-to-noise ratios ≥10 or coefficient variation (CV) area ratios <35% between transitions for each peptide (8,16). Accuracy was ensured by removing transitions due to non-specific background interference or coelution. The ratio of the peak area of the endogenous peptide to that of the isotope-labeled peptide internal standard was used as the quantification value of the endogenous peptide.
Table II.Transition list of receptor expression-enhancing protein 5 for selected reaction monitoring analysis. |
Western blotting analysis of serum
Protein determination was performed using NANODROP LITE (Thermo Fisher Scientific, Inc.). For western blotting, serum samples were separated by electrophoresis on 10–20% gradient gels (DRC Co., Ltd.). REEP5 and albumin in total serum (5.0 µg protein loaded per column) was measured in patients with PDAC and HVs. Proteins were subsequently transferred to an Immobilon-P transfer membrane (Merck KGaA) using a MINICA-MP (DRC Co., Ltd.). The membranes were blocked with 5% skimmed milk in PBS at 37°C for 1 h. After blocking, individual lanes containing the serum profile were cut into strips. These membrane strips were incubated individually at room temperature for 1 h with an anti-receptor expression-enhancing protein 5 (REEP5) polyclonal antibody (1,000-fold dilution; cat. no. 4929; Proteintech Group, Inc.). A peroxidase-conjugated anti-rabbit immunoglobulin (1,000-fold dilution; cat. no. P0260; Proteintech Group, Inc.) was used as the secondary antibody. These membrane strips were incubated individually at room temperature for 1 h. Antigen detection was performed using the Pierce ECL Plus Western blotting substrate (Thermo Fisher Scientific, Inc.).
Lectin ELISA
Serum fucosylated REEP5 was quantified using a lectin ELISA. An anti-REEP5 polyclonal antibody (Proteintech Group, Inc.) dissolved in PBS buffer was dispensed into a 96-well polystyrene microtiter plate (Thermo Fisher Scientific, Inc.) at a concentration of 0.5 µg/well and incubated at 4°C for 1 day. The plate was subsequently washed three times with PBS containing 0.05% Tween-20 (PBST). Next, the microtiter plate was coated with 20% NOF102 (NOF Co., Ltd.) containing 10% sucrose and incubated at 4°C for 1 day. After washing with PBST, 100 µl aliquots of 10-fold diluted plasma samples were added in duplicate to the wells. The plates were incubated at room temperature for 1 h and washed three times. HRP-conjugated LCA lectin (Vector Laboratories, Inc.) in PBST (100 µl) was added to each well, followed by incubation at room temperature for 30 min. The plate was washed three times, and 100 µl TMB solution (Roche Diagnostics) was added. After a 10 min incubation at room temperature, 100 µl stop solution was added, and the absorbance at 450 nm was measured. Reproducibility and potential interference were assessed as previously reported (7,26).
Other procedures
CEA and CA19-9 levels were measured using Lumipulse Presto CEA and CA19-9 kits, respectively (Fujirebio). REEP5 was measured using a Human REEP5 ELISA Kit (cat. no. HUFI05962; Assay Genie). DUPAN-2 (cat. no. 04770) and SPan-1 (cat. no. 04799) concentrations were determined using an enzyme immunoassay (EIA) from MBL International Co.
Statistical analysis
Each sample was measured in triplicate. Statistical analysis was performed using IBM SPSS Statistics 19 (IBM Corp.). Numerical data are presented as the mean ± standard deviation (SD). Differences in non-parametric data between groups were analyzed using Kruskal-Wallis tests, with P<0.05 considered to indicate a statistically significant difference. The Steel-Dwass test was used for the post hoc analysis. Receiver operating characteristic (ROC) curves were constructed to evaluate sensitivity, specificity and the area under curve (AUC).
Results
DIA proteomic analysis for discovery of PDAC biomarker candidates in serum EVs
To identify PDAC biomarker candidate proteins in serum EVs, DIA proteomic analysis was performed using EV fractions prepared from sera using the phosphatidylserine affinity method (MagCapture). Serum EVs were collected from 20 patients with PDAC, 10 patients with PT and 10 age and sex-matched HVs (first cohort). Extracted proteins were digested using the PTS method. LC-MS/MS analysis and a subsequent database search identified 3,049 proteins (FDR <1%). In the DIA analysis, 14 proteins had quantified levels that were 2.0× higher in PDAC compared with in PT and HVs, with significant differences (P<0.01; Table III). Particular attention was paid to REEP5, which had the highest fold-change (Fig. 1; Table III).
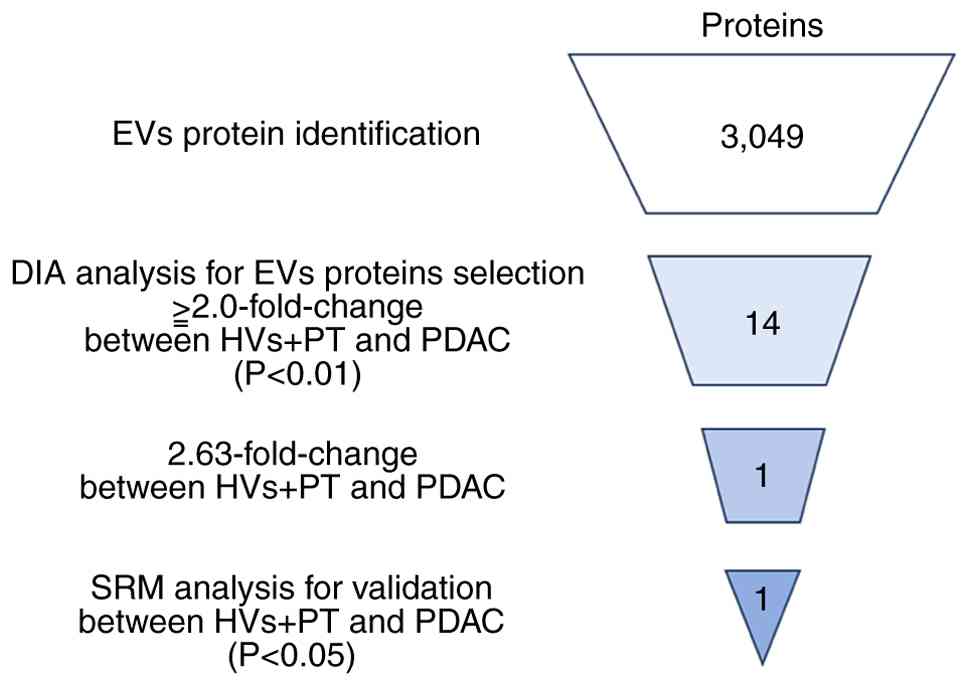
Table III.PDAC biomarker candidate proteins in extracellular vesicles identified using data-independent acquisition proteomic analysis. |
Verification of biomarker candidates using SRM
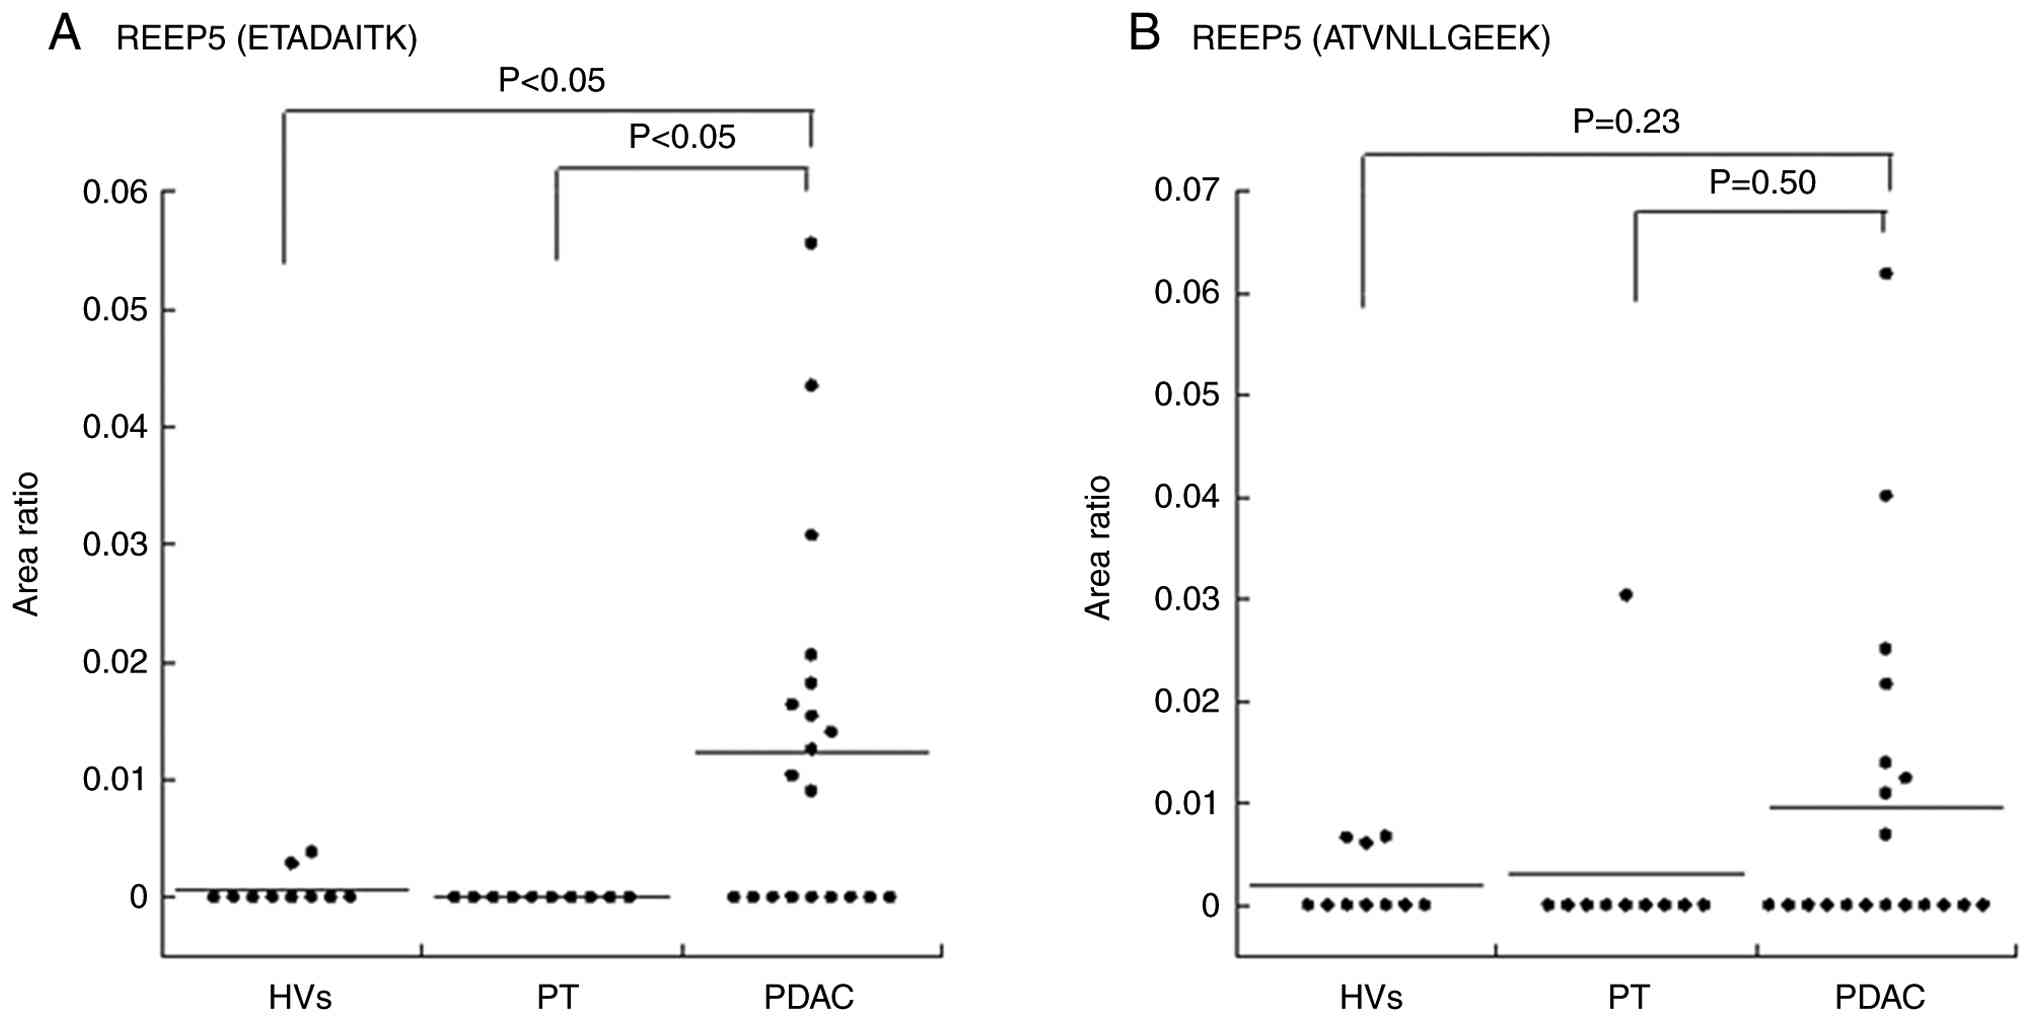
An SRM verification assay of selected biomarker candidate proteins in the serum EVs was performed. A total of two target REEP5 peptides (ETADAITK and ATVNLLGEEK) with the highest intensity in DIA were selected. Individual EV fractions were prepared from the second cohort (HVs, n=10; PT, n=10; PDAC, n=20) for SRM analyses. The quantitative value of each peptide was calculated as the ratio of the peak area of the endogenous target peptide to the isotope-labeled peptide internal standard. This value for each peptide was normalized using the average quantitative value of peptides from EV marker protein CD9 because the amount of EVs obtained from each serum sample was variable. Of the REEP5 peptides, ETADAITK was significantly higher in PDAC compared with PT and HVs (both P<0.05, Kruskal-Wallis test; Fig. 2A; Table IV). No significant difference in ATVNLLGEEK levels was observed in PDAC compared with HVs and PT (Kruskal-Wallis test; Fig. 2B; Table IV).
REEP5 is detectable in total serum using western blotting
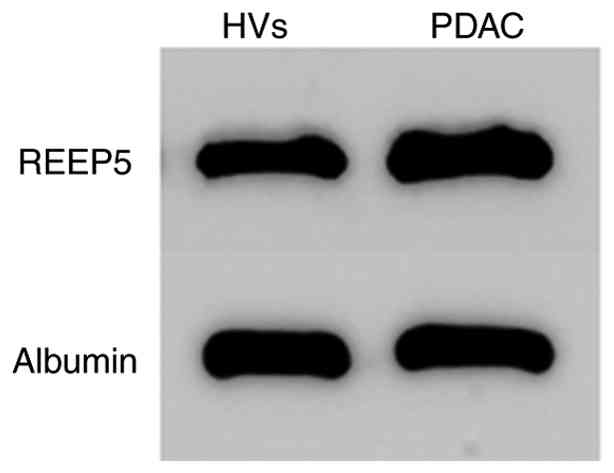
REEP5 expression was subsequently assessed in serum. Western blotting of total serum from PDAC cases and HVs showed that REEP5 was detectable in whole serum (Fig. 3).
Establishment of an ELISA for fucosylated REEP5
The precision (within-run and between-run reproducibility) of the assay was determined using two fucosylated REEP5 concentrations of 0.05 and 0.32 AU/ml. Within-assay CVs were determined with eight replicates of each sample. Between-assay CVs were determined based on assays performed on 5 different days (two replicates of each sample per day). The within-run CV was 8.1–9.8% and the between-run CV was 9.9–12.0%. Interference was assessed in samples containing 0.32 AU/ml fucosylated REEP5. Potential interference materials were added to plasma at various concentrations. There was no substantial interference from hemoglobin (up to 5,000 mg/l), free bilirubin (up to 207 mg/l), ditaurobilirubin (up to 204 mg/l), chyle (up to 1,400 formazine turbidity units, equal to 1,176 mg/l triglyceride), ascorbic acid (up to 500 mg/l) and rheumatoid factor (up to 500 U/l) (data not shown).
Quantification of serum REEP5 using ELISA
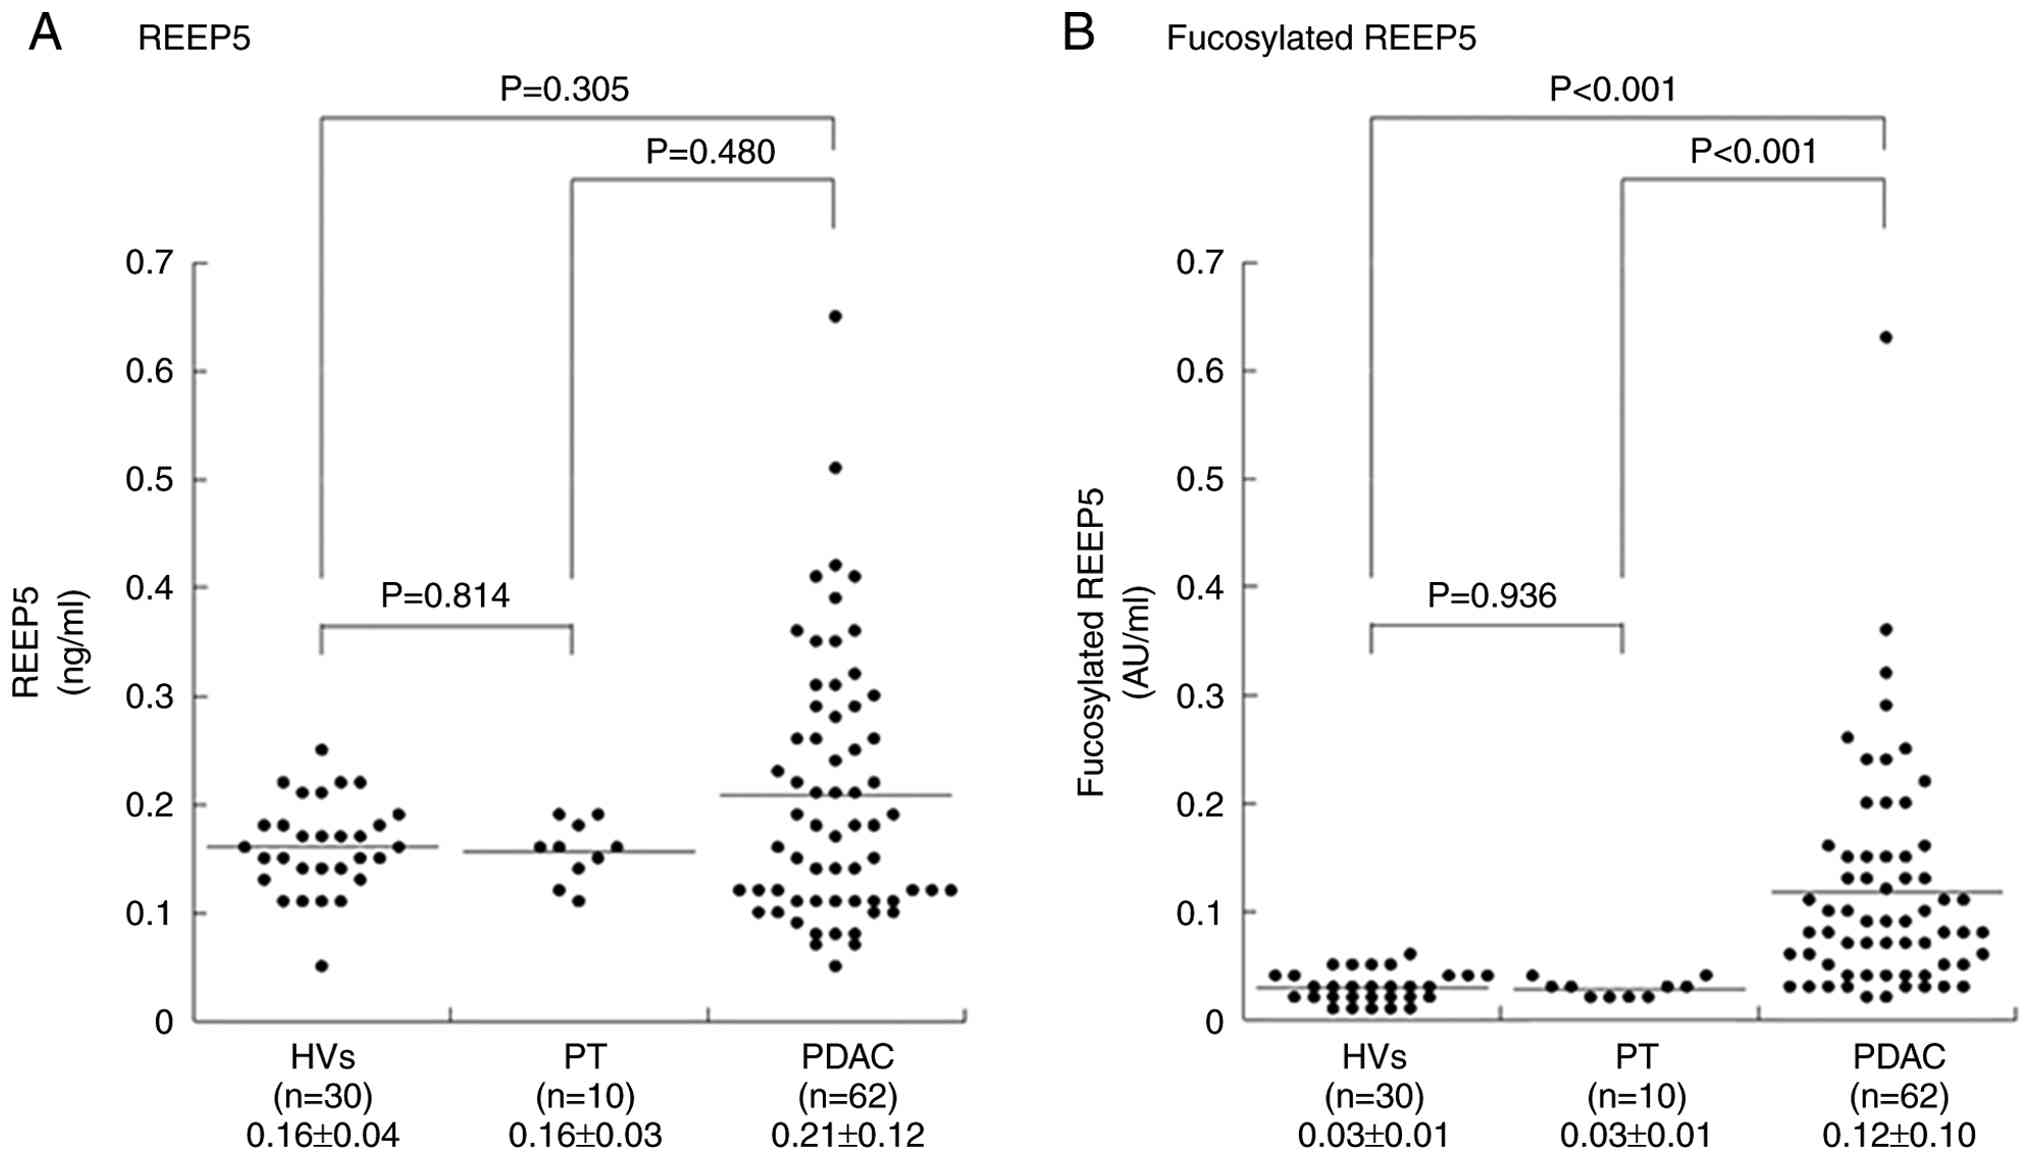
The serum REEP5 levels in the third cohort (HVs, n=30; PT, n=10; PDAC, n=63) were 0.16±0.04, 0.16±0.03 and 0.21±0.12 ng/ml in HVs, PT and PDAC, respectively (Fig. 4A), with no significant difference between HVs and PDAC cases (P=0.305).
Serum fucosylated REEP5 is significantly increased in PDAC
Fucosylated oligosaccharides are often used as cancer biomarkers (27–31). For example, CA19-9, a fucosylated oligosaccharide [sialyl Lea (NeuAcα2-3Galβ1-3(Fucα1-4)GlcNAcβ1-R)] is a biomarker for pancreatic cancer. Therefore, we hypothesized that fucosylated REEP5 might be a biomarker for early stage pancreatic cancer, and an ELISA was developed for fucosylated REEP5. Serum fucosylated REEP5 in the third cohort was significantly higher in PDAC (0.12±0.10 AU/ml) compared with in HVs (0.03±0.01 AU/ml) and PT (0.03±0.01 AU/ml) (PDAC vs. HVs and PT, both P<0.001; Kruskal-Wallis test; Fig. 4B).
Serum fucosylated REEP5 is superior to CEA, CA19-9, DUPAN-2 and SPan-1 for early detection of PDAC
Serum levels of fucosylated REEP5, CEA and CA19-9 in 62 PDAC cases in Union for International Cancer Control stages I (n=21), II (n=22), III (n=15) and IV (n=4) and in 30 HVs and 10 PT cases are shown in Table V and Fig. 5. Cutoffs for the three markers were set at levels that gave 95.0% specificity for PDAC compared with HVs and PT: 0.05 AU/ml for fucosylated REEP5, 5.5 ng/dl for CEA and 37.7 U/ml for CA19-9. In the 62 PDAC cases, the sensitivities of fucosylated REEP5, CEA and CA19-9 were 75.8, 17.7 and 62.9%, respectively (data not shown). The fucosylated REEP5 level was above the cutoff in 20 of 22 PDAC cases (90.0%) in which the serum level of CA19-9 was below its cutoff value (data not shown). The AUCs of ROC curves were 0.928 for fucosylated REEP5 and 0.805 for CA19-9 for distinguishing cancer (PDAC) from non-cancer (HVs and PT) cases (Fig. 6A). The ratio of serum fucosylated REEP5 to total serum REEP5 in the third cohort was significantly higher in PDAC (0.52±0.20 AU/ml) compared with in HVs (0.17±0.05 AU/ml) and PT (0.18±0.02 AU/ml) (PDAC vs. HVs and PT, P<0.001; Kruskal-Wallis test) (data not shown). Serum fucosylated REEP5 and the ratio of serum fucosylated REEP5 to total serum REEP5 differed significantly among HVs, PT and PDAC, showing a consistent trend. Thus, serum fucosylated REEP5 may be a useful biomarker for detecting pancreatic cancer, and may be an improved diagnostic PDAC biomarker compared with serum CA19-9.
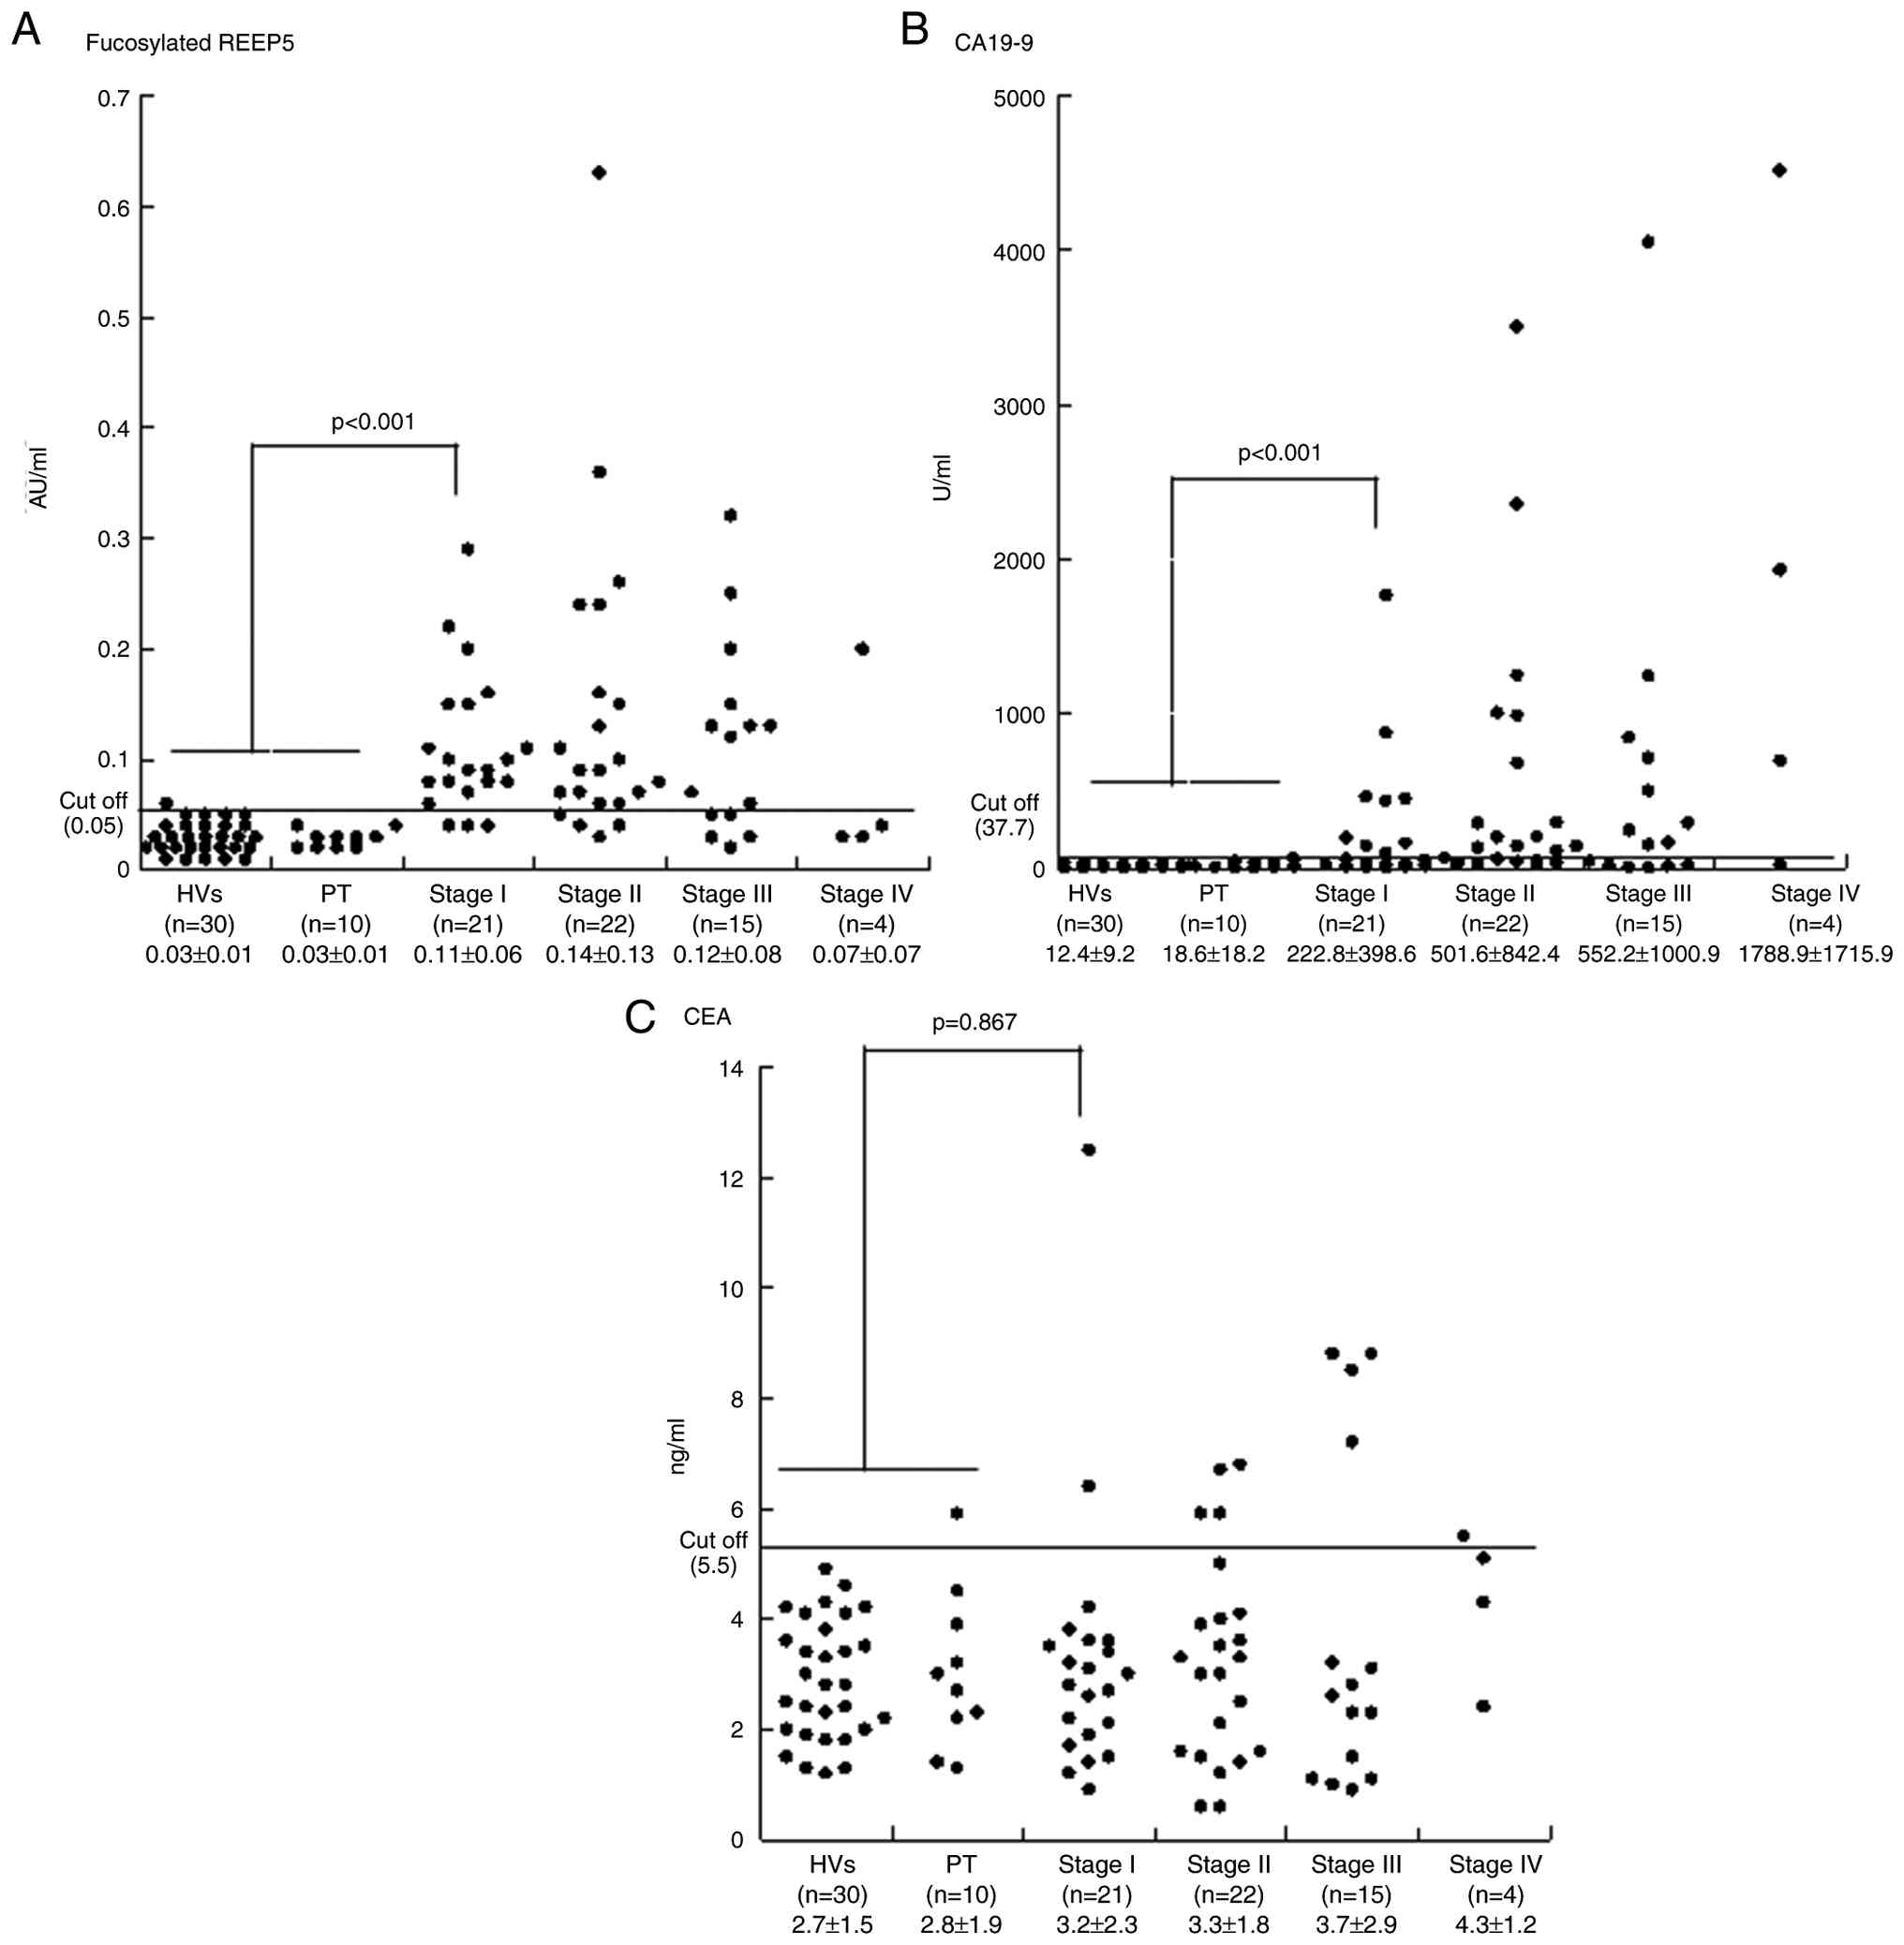
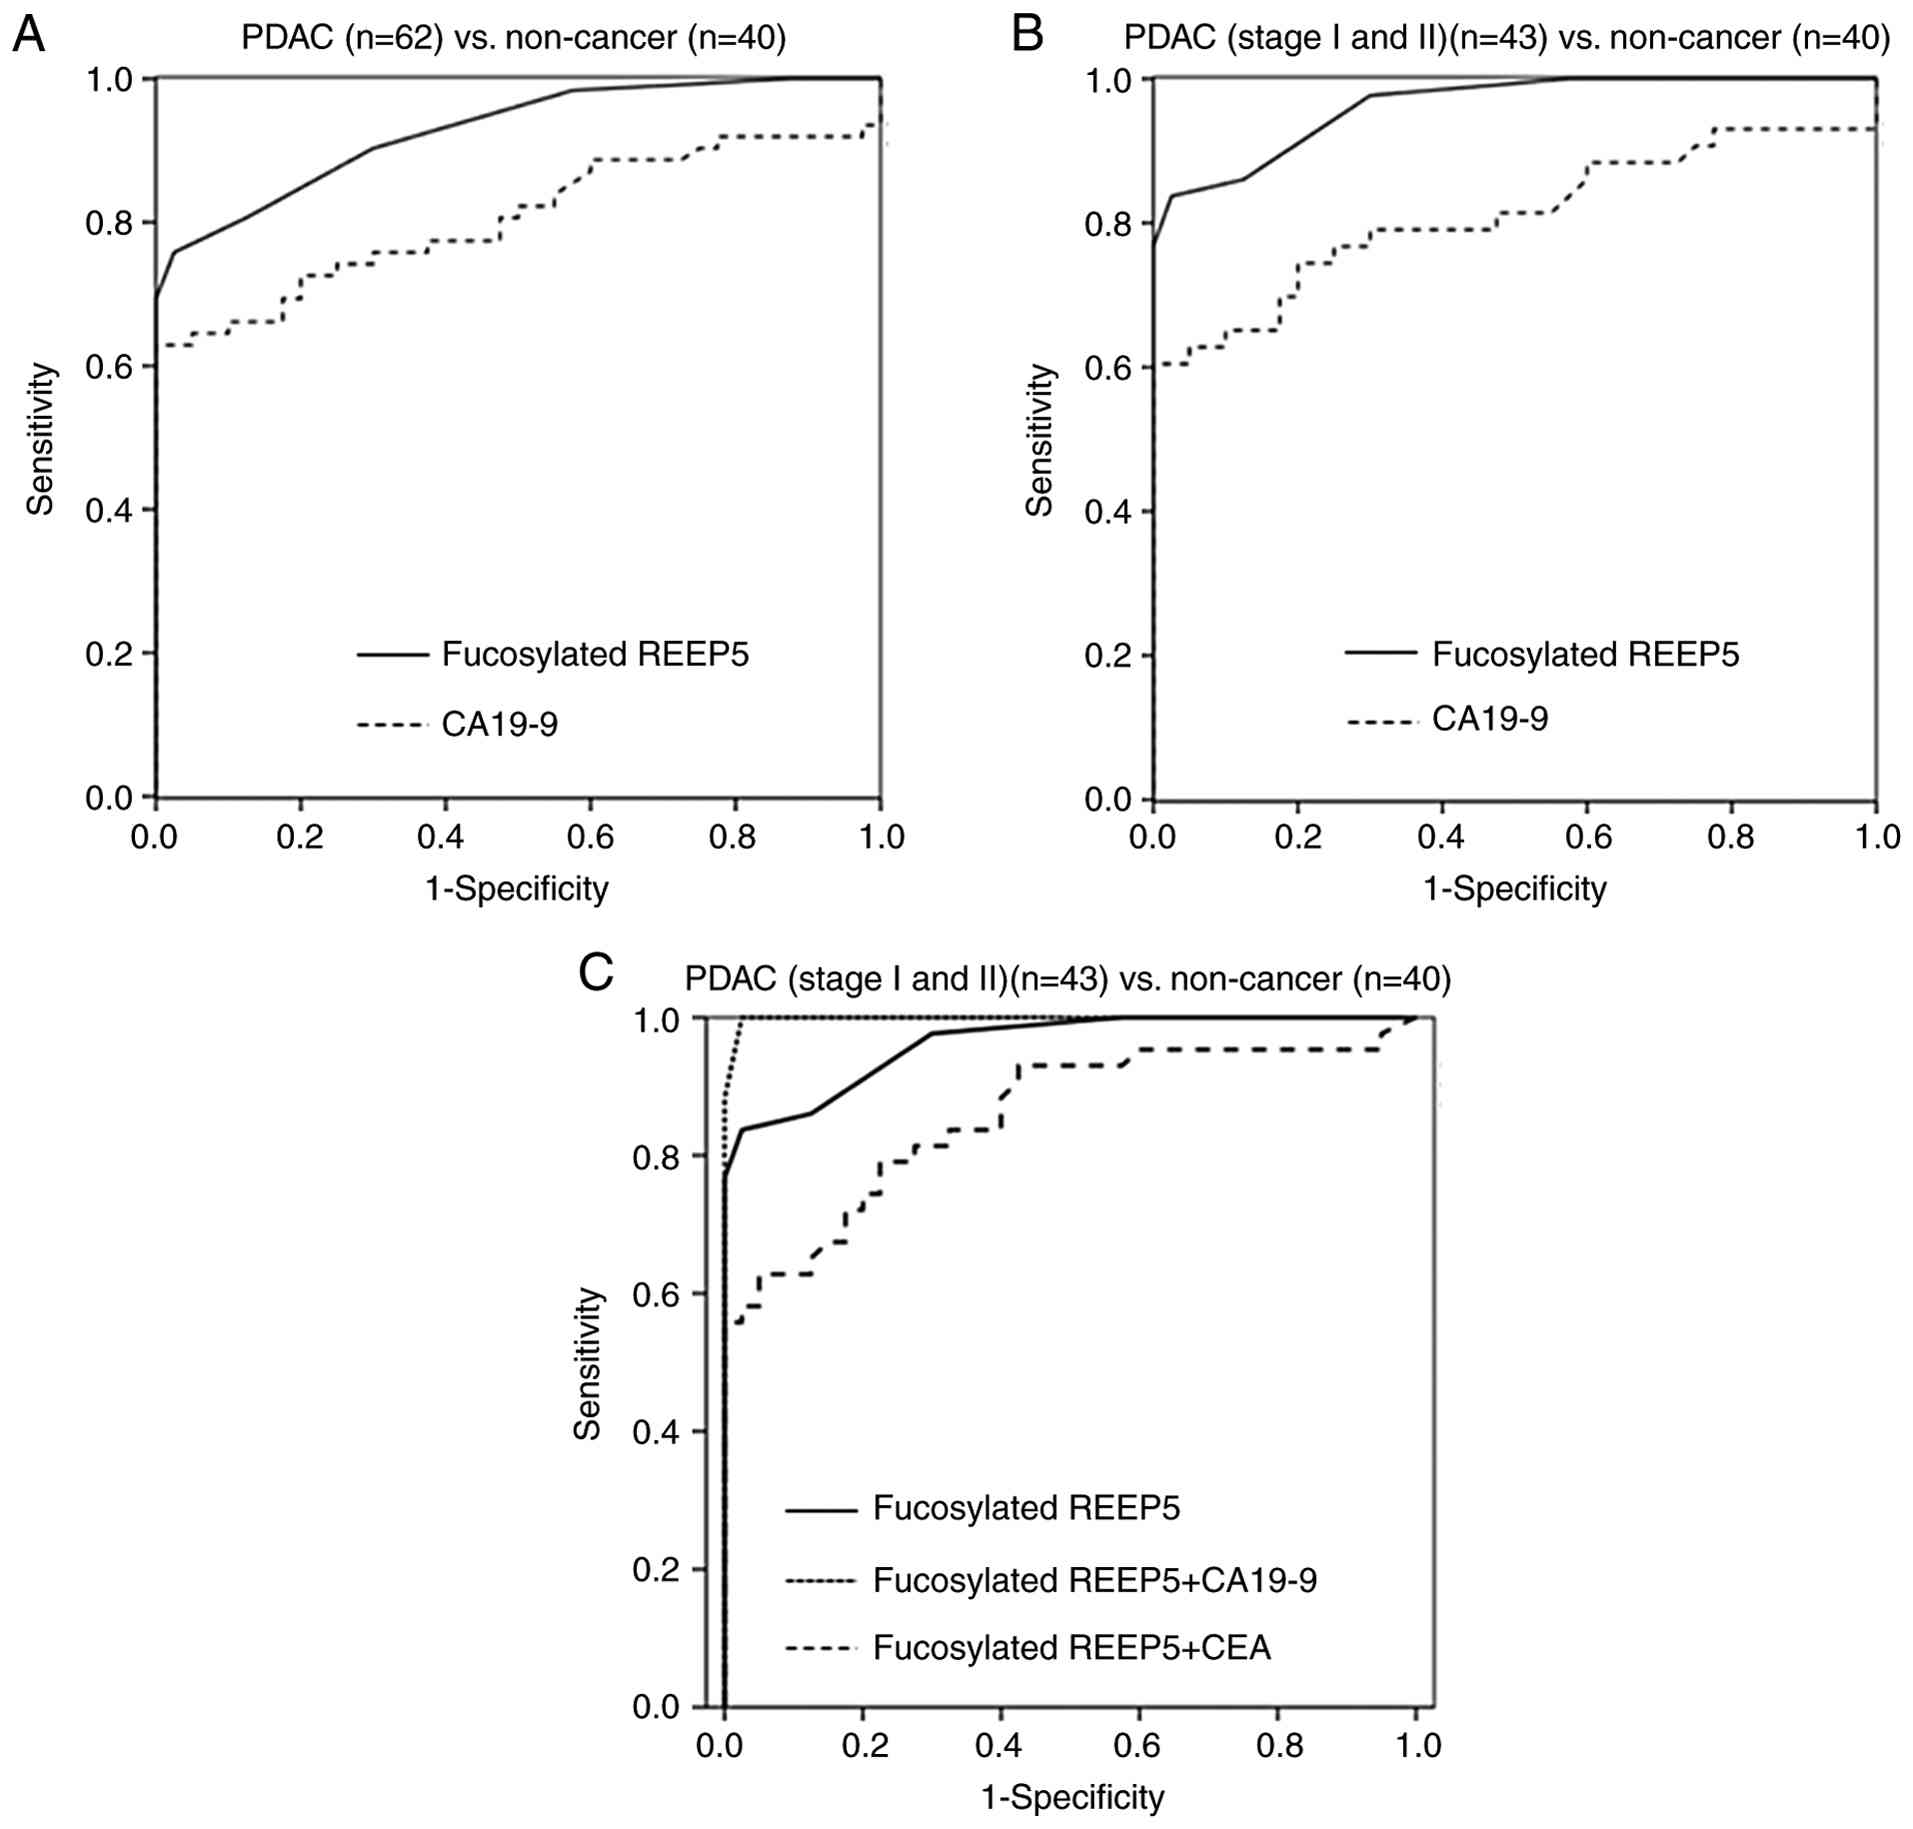
To evaluate whether fucosylated REEP5 is useful for early detection of PDAC, serum REEP5 and CA19-9 levels in early stage PDAC (stages I and II) cases were compared with those in non-cancer cases (HVs and PT). In 43 early stage PDAC cases, the sensitivities of fucosylated REEP5, CEA and CA19-9 at cutoffs that gave 95.0% specificity were 83.7, 14.0 and 60.5%, respectively (Fig. 5). The sensitivities of DUPAN-2 and SPan-1 at their respective cutoffs (DUPAN-2, 150 U/ml; SPan-1, 30 U/ml) were 20.9 and 41.9%, respectively (Table VI). The AUCs of ROC curves for distinguishing early stage PDAC from non-cancer cases were 0.962 for fucosylated REEP5 and 0.810 for CA19-9. These results indicate that REEP5 is superior to CA19-9 as an early diagnostic biomarker for PDAC (Fig. 6B). In early-stage PDAC cases, the sensitivity of fucosylated REEP5 in combination with CEA and CA19-9 was 67.4 and 86.4%, respectively, and the specificity was 85.7 and 100.0%, respectively. The AUCs of ROC curves for distinguishing PDAC (stages I and II) from non-cancer cases for fucosylated REEP5 alone and in combination with CEA and CA19-9 were 0.962, 0.857 and 0.999, respectively (Fig. 6C).
Discussion
REEP5 is a member of a protein family that comprises REEP1 through REEP6. This family serves crucial roles in various cellular processes, including the shaping and remodeling of endoplasmic reticulum morphology (32–34), regulation of the microtubule cytoskeleton (35) and transport and expression of G protein-coupled receptors (36), among other key pathophysiological functions. REEP3 expression is markedly elevated in pancreatic cancer compared with normal tissues (37), and elevated REEP3 expression is associated with unfavorable overall and relapse-free survival, establishing it as a notable adverse prognostic marker in pancreatic cancer (37). REEP5 serves a key role in maintaining normal function of the cardiac sarcoplasmic reticulum (38,39). Chiamvimonvat and Song (40) showed that REEP5, as the only REEP family protein enriched in the heart, is a regulator of cardiac excitation-contraction coupling. REEP5 knockdown affects C-X-C motif chemokine receptor 1 and downregulates the IL-8-mediated cellular response, which reduces growth and invasion of lung cancer cells (41), whereas REEP5 is downregulated in breast cancer tissues (42).
Improvement of therapeutic outcomes of PDAC requires early detection and treatment with surgical resection. Screening tests in health checkups can be used for early detection of numerous cancers, but this is challenging for PDAC (43). In blood tests, hepatic enzymes are often increased and CA19-9 is a diagnostic marker of PDAC (43). A previous report showed greater elevation of CA19-9 in advanced stage cases and a smaller increase with 53% sensitivity in early stage I and II cases (44). Indeed, patients with early stage I and II of PDAC in the cohort of the present study showed 60.5% sensitivity for CA19-9.
In previous years, new biomarkers have been found through advances in proteomics techniques, but a number are still not used in clinical practice (17). Ideally in biomarker development, control and disease groups are compared using a semiquantitative method to search for candidate markers in the discovery phase. The identified candidates are subsequently transferred to a validation phase that may include an ELISA, which is the most common assay in current use. However, it is often difficult to reproduce MS-based quantitative results for the candidate markers using an ELISA, as seen in the present results. The reason why REEP5 was increased in EVs of PDAC compared to HVs and PT, but not in serum, may be because EV proteins were measured using MS, which is more sensitive than ELISA. Thus, the use of MS may be more appropriate to quantify candidate biomarker proteins identified by proteomic analysis. Alternatively, the level of soluble REEP5 protein in serum may be the same among HVs, PT and PDAC, but increased in EVs in PDAC. In this case, the increased secretion of REEP5 in EVs may be due to the high expression of REEP5 protein in pancreatic cancer tissue.
Fucosylated oligosaccharides and proteins have been used as cancer biomarkers since they were demonstrated to be increased in serum of patients with cancer several decades ago. Fucosylated a-fetoprotein (AFP), which is referred to as the AFP-L3 fraction after the measurement method, has been used clinically as a biomarker for hepatocellular carcinoma since 1996 in Japan and 2005 in the United States (27,28). Similarly, a fucosylated oligosaccharide, sialyl Lea (sLex), has been used as a biomarker for pancreatic cancer (29). Binding of sLex or sLea on cancer cells to E-selectin on endothelial cells facilitates tumor metastasis (30), and expression of these proteins is associated with a poor prognosis of colon cancer (31).
Fucosylated complement component 4 binding protein α (C4BPA) has previously been reported as an early diagnostic marker for pancreatic cancer (17). Serum C4BPA was elevated in PDAC compared with HVs and PT (P<0.01), with serum fucosylated C4BPA more significantly elevated in PDAC (P<0.0001). In early stage pancreatic cancer, the increase in fucosylation was more prominent compared with the increase in total C4BPA, possibly due to activation of fucosylation enzymes in PDAC (45). Similarly, REEP5 was low in most PDAC cases and did not differ markedly from those in HVs or PT. By contrast, fucosylated REEP5 levels were significantly higher in PDAC cases compared with in HVs and PT, although some samples did not show increased levels of fucosylated REEP5.
These findings provided a basis for investigation of fucosylated proteins and to develop an ELISA for REEP5. Using this approach, serum fucosylated REEP5 was identified as a new PDAC biomarker. Serum fucosylated REEP5 levels were 0.03±0.01, 0.03±0.01 and 0.12±0.10 AU/ml in HVs, PT and PDAC, respectively, and differed significantly between PDAC and HV and PT cases, but not between PT and HVs. Most stage I PDAC cases (83.7%) were positive for serum fucosylated REEP5, whereas only 60.5% of these cases were positive for CA19-9. These results indicate that serum fucosylated REEP5 is complementary to conventional markers and may be useful for detection of PDAC in clinical practice.
The present study has several limitations. First, the screen did not find previously identified tumor markers, most of which are glycoproteins, including CA 19-9. It might be because the methodology used did not target carbohydrate-containing proteins. Second, although EV proteins were focused on for biomarker discovery, the biomarker candidate protein REEP5 was assessed using whole serum. This is due to the difficulties to use whole serum for biomarker discovery by MS and to analyze EVs for verification. The dynamic range of blood proteins is extremely wide which is a disadvantage for measurement using MS. If a candidate protein is present only in small amounts, its detection in total blood protein may be challenging, even with use of SRM (8). On the other hand, consistent extraction of EVs from large sample sets for biomarker verification is laborious, therefore whole serum was used for verification. The use of whole serum instead of EVs may be the reason why the results of REEP5 could not be reproduced. Third, the present study is a retrospective study involving a small sample size. Further validation in independent, prospective, large-scale cohorts is necessary to establish fucosylated REEP5 as a more promising serodiagnostic biomarker for PDAC compared with CA19-9.
Finally, fucosylated REEP5 is associated with PDAC, but its potential biological functions and mechanisms in the development and progression of PDAC remain unclear. Understanding the expression and localization of REEP5 in PDAC, as well as the impact of its fucosylation, is essential. Core fucosylation comprises the transfer of α-1,6-fucose to the innermost GlcNAc residue of N-glycans by fucosyltransferase 8 (FUT8) (46). Core fucosylation mediated by FUT8 is one of the most important glycan modifications involved in cancer and inflammation (46). Watanabe et al (47) reported that FUT8 expression increases gradually from normal pancreatic duct to adenoma and then carcinoma in an intraductal papillary mucinous neoplasm, a mucinous cystic tumor of the pancreas with malignant transformation potential. This suggests that increased FUT8 expression, and thus activation of the core fucosylation reaction, may serve a key role in the malignancy of pancreatic cancer (45). The functional analysis of REEP5 fucosylation is challenging due to the unidentified enzymes responsible for the modification and the unknown fucosylation sites on the protein.
In conclusion, the present study established a novel lectin ELISA for the measurement of serum fucosylated REEP5. Serum fucosylated REEP5 has notable diagnostic ability with potential applications for PDAC.
Acknowledgements
Not applicable.
Funding
The present study was supported by a Grant-in-Aid for Scientific Research (grant no. KAKENHI C: 22K07406).
Availability of data and materials
The data generated in the present study may be found in the ProteomeXchange Consortium via the jPOST repository under accession number PXD066048 or at the following URL: https://repository.jpostdb.org/entry/JPST003936. The rest of the data generated in the present study may be requested from the corresponding author.
Authors' contributions
KS was a major contributor in writing the manuscript. ST and TT contributed to manuscript drafting or critical revisions on the intellectual content. RY, MS, SM and JA carried out the proteomics experiments and the bioinformatics analysis. ST, HT and MO contributed to collecting the samples, the ethics application and interpretation of the data. KS and TT confirm the authenticity of all the raw data. KS, RY, MS, SM, JA, ST, HT, MO and TT contributed to the analysis and interpretation of the data. All authors read and approved the final version of the manuscript.
Ethics approval and consent to participate
The study was performed in accordance with the guidelines established by the Declaration of Helsinki and was approved by the Ethics Committee of Chiba University (approval nos. 2155 and M10831), Azabu University (approval nos. 2539 and 0129) and Kashiwado Memorial Foundation (approval no. 002).
Patient consent for publication
Written informed consent was provided by patients for collection and publication of clinical data and information.
Competing interests
The authors declare that they have no competing interests.
Glossary
Abbreviations
Abbreviations:
|
AFP |
α-fetoprotein |
|
AUC |
area under the curve |
|
DIA |
data-independent acquisition |
|
ELISA |
enzyme-linked immunosorbent assay |
|
EVs |
extracellular vesicles |
|
FDR |
false discovery rate |
|
HV |
healthy volunteer |
|
MS |
mass spectrometry |
|
PBST |
PBS containing 0.05% Tween-20 |
|
PDAC |
pancreatic ductal adenocarcinoma |
|
PT |
chronic pancreatitis |
|
PTS |
phase transfer surfactant |
|
REEP5 |
receptor expression-enhancing protein 5 |
|
ROC |
receiver operating characteristic |
|
SD |
standard deviation |
|
sLex |
sialyl Lea |
|
SRM |
selected reaction monitoring |
References
|
Siegel RL, Giaquinto AN and Jemal A: Cancer statistics, 2024. CA Cancer J Clin. 74:12–49. 2024. | |
|
Hu ZI and O'Reilly EM: Therapeutic developments in pancreatic cancer. Nat Rev Gastroenterol Hepatol. 21:7–24. 2024. View Article : Google Scholar | |
|
Hanada K, Shimizu A, Tsushima K, Ikeda M and Tazuma S: Diagnosis of the early-stage pancreatic cancer and collaboration of local clinics and hospitals. Nippon Rinsho. 81:513–518. 2023. | |
|
Kanno A, Masamune A, Hanada K, Maguchi H, Shimizu Y, Ueki T, Hasebe O, Ohtsuka T, Nakamura M, Takenaka M, et al: Multicenter study of early pancreatic cancer in Japan. Pancreatology. 18:61–67. 2018. View Article : Google Scholar | |
|
Tkach M and Théry C: Communication by extracellular vesicles: Where we are and where we need to go. Cell. 164:1226–1232. 2016. View Article : Google Scholar | |
|
Welsh JA, Goberdhan DCI, O'Driscoll L, Buzas EI, Blenkiron C, Bussolati B, Cai H, Di Vizio D, Driedonks TAP, Erdbrügger U, et al: Minimal information for studies of extracellular vesicles (MISEV2023): From basic to advanced approaches. J Extracell Vesicles. 13:e124042024. View Article : Google Scholar | |
|
Koba T, Takeda Y, Narumi R, Shiromizu T, Nojima Y, Ito M, Kuroyama M, Futami Y, Takimoto T, Matsuki T, et al: Proteomics of serum extracellular vesicles identifies a novel COPD biomarker, fibulin-3 from elastic fibres. ERJ Open Res. 7:00658–2020. 2021. View Article : Google Scholar | |
|
Shiromizu T, Kume H, Ishida M, Adachi J, Kano M, Matsubara H and Tomonaga T: Quantitation of putative colorectal cancer biomarker candidates in serum extracellular vesicles by targeted proteomics. Sci Rep. 7:127822017. View Article : Google Scholar | |
|
Hoshino A, Costa-Silva B, Shen TL, Rodrigues G, Hashimoto A, Tesic Mark M, Molina H, Kohsaka S, Di Giannatale A, Ceder S, et al: Tumour exosome integrins determine organotropic metastasis. Nature. 527:329–335. 2015. View Article : Google Scholar | |
|
Phinney DG and Pittenger MF: Concise review: MSC-derived exosomes for cell-free therapy. Stem Cells. 35:851–858. 2017. View Article : Google Scholar | |
|
Kasahara K, Narumi R, Nagayama S, Masuda K, Esaki T, Obama K, Tomonaga T, Sakai Y, Shimizu Y and Adachi J: A large-scale targeted proteomics of plasma extracellular vesicles shows utility for prognosis prediction subtyping in colorectal cancer. Cancer Med. 12:7616–7626. 2023. View Article : Google Scholar | |
|
Bandu R, Oh JW and Kim KP: Mass spectrometry-based proteome profiling of extracellular vesicles and their roles in cancer biology. Exp Mol Med. 51:1–10. 2019. View Article : Google Scholar | |
|
Kim H, Kim DW and Cho JY: Exploring the key communicator role of exosomes in cancer microenvironment through proteomics. Proteome Sci. 17:52019. View Article : Google Scholar | |
|
Muraoka S, Kume H, Watanabe S, Adachi J, Kuwano M, Sato M, Kawasaki N, Kodera Y, Ishitobi M, Inaji H, et al: Strategy for SRM-based verification of biomarker candidates discovered by iTRAQ method in limited breast cancer tissue samples. J Proteome Res. 11:4201–4210. 2012. View Article : Google Scholar | |
|
Narumi R, Murakami T, Kuga T, Adachi J, Shiromizu T, Muraoka S, Kume H, Kodera Y, Matsumoto M, Nakayama K, et al: A strategy for large-scale phosphoproteomics and SRM-based validation of human breast cancer tissue samples. J Proteome Res. 11:5311–5322. 2012. View Article : Google Scholar | |
|
Kume H, Muraoka S, Kuga T, Adachi J, Narumi R, Watanabe S, Kuwano M, Kodera Y, Matsushita K, Fukuoka J, et al: Discovery of colorectal cancer biomarker candidates by membrane proteomic analysis and subsequent verification using selected reaction monitoring (SRM) and tissue microarray (TMA) analysis. Mol Cell Proteomics. 13:1471–1484. 2014. View Article : Google Scholar | |
|
Sogawa K, Yamanaka S, Takano S, Sasaki K, Miyahara Y, Furukawa K, Takayashiki T, Kuboki S, Takizawa H, Nomura F and Ohtsuka M: Fucosylated C4b-binding protein α-chain, a novel serum biomarker that predicts lymph node metastasis in pancreatic ductal adenocarcinoma. Oncol Lett. 21:1272021. View Article : Google Scholar | |
|
Théry C, Amigorena S, Raposo G and Clayton A: Isolation and characterization of exosomes from cell culture supernatants and biological fluids. Curr Protoc Cell Biol Chapter 3. Unit 3.22. 2006. | |
|
Lamparski HG, Metha-Damani A, Yao JY, Patel S, Hsu DH, Ruegg C and Le Pecq JB: Production and characterization of clinical grade exosomes derived from dendritic cells. J Immunol Methods. 270:211–226. 2002. View Article : Google Scholar | |
|
Muraoka S, Hirano M, Isoyama J, Nagayama S, Tomonaga T and Adachi J: Comprehensive proteomic profiling of plasma and serum phosphatidylserine-positive extracellular vesicles reveals tissue-specific proteins. iScience. 25:1040122022. View Article : Google Scholar | |
|
Masuda T, Tomita M and Ishihama Y: Phase transfer surfactant-aided trypsin digestion for membrane proteome analysis. J Proteome Res. 7:731–740. 2008. View Article : Google Scholar | |
|
Rappsilber J, Mann M and Ishihama Y: Protocol for micro-purification, enrichment, pre-fractionation and storage of peptides for proteomics using StageTips. Nat Protoc. 2:1896–1906. 2007. View Article : Google Scholar | |
|
Tyanova S, Temu T and Cox J: The MaxQuant computational platform for mass spectrometry-based shotgun proteomics. Nat Protoc. 11:2301–2319. 2016. View Article : Google Scholar | |
|
MacLean B, Tomazela DM, Shulman N, Chambers M, Finney GL, Frewen B, Kern R, Tabb DL, Liebler DC and MacCosset MJ: Skyline: An open source document editor for creating and analyzing targeted proteomics experiments. Bioinformatics. 26:966–968. 2010. View Article : Google Scholar | |
|
Narumi R, Shimizu Y, Ukai-Tadenuma M, Ode KL, Kanda GN, Shinohara Y, Sato A, Matsumoto K and Ueda HR: Mass spectrometry-based absolute quantification reveals rhythmic variation of mouse circadian clock proteins. Proc Natl Acad Sci USA. 113:E3461–E3467. 2016. View Article : Google Scholar | |
|
Miyahara Y, Takano S, Sogawa K, Tomizawa S, Furukawa K, Takayashiki T, Kuboki S and Ohtsuka M: Prosaposin, tumor-secreted protein, promotes pancreatic cancer progression by decreasing tumor-infiltrating lymphocytes. Cancer Sci. 113:2548–2559. 2022. View Article : Google Scholar | |
|
Aoyagi Y, Isemura M, Suzuki Y, Sekine C, Soga K, Ozaki T and Ichida F: Fucosylated alpha-fetoprotein as marker of early hepatocellular carcinoma. Lancet. 2:1353–1354. 1985. View Article : Google Scholar | |
|
Food and Drug Administration, HHS Medical devices; immunology and microbiology devices; classification of AFP-L3% immunological test systems, . Final rule. Fed Regist. 70:57748–57750. 2005. | |
|
Szymendera JJ: Clinical usefulness of three monoclonal antibody-defined tumor markers: CA 19-9, CA 50, and CA 125. Tumour Biol. 7:333–342. 1986. | |
|
Konstantopoulos K and Thomas SN: Cancer cells in transit: The vascular interactions of tumor cells. Annu Rev Biomed Eng. 11:177–202. 2009. View Article : Google Scholar | |
|
Nakamori S, Kameyama M, Imaoka S, Furukawa H, Ishikawa O, Sasaki Y, Kabuto T, Iwanaga T, Matsushita Y and Irimura T: Increased expression of sialyl Lewisx antigen correlates with poor survival in patients with colorectal carcinoma: Clinicopathological and immunohistochemical study. Cancer Res. 53:3632–3637. 1993. | |
|
Park SH, Zhu PP, Parker RL and Blackstone C: Hereditary spastic paraplegia proteins REEP1, spastin, and atlastin-1 coordinate microtubule interactions with the tubular ER network. J Clin Investig. 120:1097–1110. 2010. View Article : Google Scholar | |
|
Esteves T, Durr A, Mundwiller E, Loureiro JL, Boutry M, Gonzalez MA, Gauthier J, El-Hachimi KH, Depienne C, Muriel MP, et al: Loss of association of REEP2 with membranes leads to hereditary spastic paraplegia. Am J Hum Genet. 94:268–277. 2014. View Article : Google Scholar | |
|
Kumar D, Golchoubian B, Belevich I, Jokitalo E and Schlaitz AL: REEP3 and REEP4 determine the tubular morphology of the endoplasmic reticulum during mitosis. Mol Biol Cell. 30:1377–1389. 2019. View Article : Google Scholar | |
|
Schlaitz AL, Thompson J, Wong CCL, Yates JR III and Heald R: REEP3/4 ensure endoplasmic reticulum clearance from metaphase chromatin and proper nuclear envelope architecture. Dev Cell. 26:315–323. 2013. View Article : Google Scholar | |
|
Behrens M, Bartelt J, Reichling C, Winnig M, Kuhn C and Meyerhof W: Members of RTP and REEP gene families influence functional bitter taste receptor expression. J Biol Chem. 281:20650–20659. 2006. View Article : Google Scholar | |
|
Liu GH, Tan XY, Xu ZY, Li JX, Zhong GH, Zhai JW and Li MY: REEP3 is a potential diagnostic and prognostic biomarker correlated with immune infiltration in pancreatic cancer. Sci Rep. 14:138342024. View Article : Google Scholar | |
|
Yao L, Xie D, Geng L, Shi D, Huang J, Wu Y, Lv F, Liang D, Li L, Liu Y, et al: REEP5 (receptor accessory protein 5) acts as a sarcoplasmic reticulum membrane sculptor to modulate cardiac function. J Am Heart Assoc. 7:e0072052018. View Article : Google Scholar | |
|
Li M, Rao M, Chen K, Zhou J and Song J: Selection of reference genes for gene expression studies in heart failure for left and right ventricles. Gene. 620:30–35. 2017. View Article : Google Scholar | |
|
Chiamvimonvat N and Song LS: LRRC10 (leucine-rich repeat containing protein 10) and REEP5 (receptor accessory protein 5) as novel regulators of cardiac excitation-contraction coupling structure and function. J Am Heart Assoc. 7:e0082602018. View Article : Google Scholar | |
|
Park CR, You DJ, Park S, Mander S, Jang DE, Yeom SC, Oh SH, Ahn C, Lee SH, Seong JY and Hwang JI: The accessory proteins REEP5 and REEP6 refine CXCR1-mediated cellular responses and lung cancer progression. Sci Rep. 6:390412016. View Article : Google Scholar | |
|
Tian Z, He W, Tang J, Liao X, Yang Q, Wu Y and Wu G: Identification of important modules and biomarkers in breast cancer based on WGCNA. Onco Targets Ther. 13:6805–6817. 2020. View Article : Google Scholar | |
|
Kimura K, Ohto M, Saisho H, Unozawa T, Tsuchiya Y, Morita M, Ebara M, Matsutani S and Okuda K: Association of gallbladder carcinoma and anomalous pancreaticobiliary ductal union. Gastroenterology. 89:1258–1265. 1985. View Article : Google Scholar | |
|
Athanasiou A, Kureshi N, Wittig A, Sterner M, Huber R, Palma NA, King T and Schiess R: Biomarker discovery for early detection of pancreatic ductal adenocarcinoma (PDAC) using multiplex proteomics technology. J Proteome Res. 24:315–322. 2025. View Article : Google Scholar | |
|
Tada K, Ohta M, Hidano S, Watanabe K, Hirashita T, Oshima Y, Fujnaga A, Nakanuma H, Masuda T, Endo Y, et al: Fucosyltransferase 8 plays a crucial role in the invasion and metastasis of pancreatic ductal adenocarcinoma. Surg Today. 50:767–777. 2020. View Article : Google Scholar | |
|
Pinho SS and Reis CA: Glycosylation in cancer: Mechanisms and clinical implications. Nat Rev Cancer. 15:540–555. 2015. View Article : Google Scholar | |
|
Watanabe K, Ohta M, Yada K, Komori Y, Iwashita Y, Kashima K and Inomata M: Fucosylation is associated with the malignant transformation of intraductal papillary mucinous neoplasms: A lectin microarray-based study. Surg Today. 46:1217–1223. 2016. View Article : Google Scholar |